Velocity is Among the Top 8 Applications in the World / Hürriyet

Digital workplace platform Velocity, developed by PEAKUP, was chosen as one of the top 8 applications in the world. Velocity that has been chosen among thousands of apps uploaded to Microsoft Teams Store is the only Turkish application chosen. A lot of criteria from user-friendliness to prevalence were taken into consideration in the evaluation done by Microsoft Corp. that has its center in Seattle, USA.  

One of the top 8 application among all apps integrated to Microsoft Teams in global was evaluated as the strategic app that is believed to create highest amount of benefits, the app that has authority in digital marketing and the app that has the greatest potential to achieve global prevalence.

The notion of “digital workplace” that everybody is talking about gain more importance day by day in terms of the cloud services it contains, getting rid of geographical barriers with mobility and artificial intelligence apps and enabling access to information 24/7. Increasing employee commitment, making a difference in terms of working together and efficient, content/document management and facilitating work processes are among the most important goal of digital workplace applications. Velocity that has been developed in order to achieve these goals, claim to interaction between workers thanks to its collective structure and provide efficiency in the corporations.

The first step of adapting workers who are biased to working on digital platforms fast goes through intranet platforms. Intranet platform Velocity that digitalizes communication processes and makes the use as simple as possible, is one of the most helpful tools in the digitalization process of the companies.

Today Microsoft Teams that has 75 million daily single users and hosts 200 million meeting participants can be ingratiated with digital workplace platform Velocity. Velocity helps you to access a lot of information from your files to announcement, from LPPD to clarification texts and work procedures, from your documents to horoscope and service hours when used on Microsoft Teams. This way you can reach out to all your workers at the same time and at the same speed, and maintain your communication from one center.

A Fast Report with Power BI In 18 Minutes and 23 Seconds

Hello dear reader! In this post I created a beginner-level guide for creating a fast report for people who never got to meet with Power BI but want to learn something about it or people who want to brush up on their information. We are talking about 18 minutes here. We cannot even get ready to get out of home in 18 minutes. 😂 If Power BI is not downloaded on your computer you can download the latest version here. Let’s start!

1- Where is your Data Source?

I thought it would be nice to start with a logical question since we know that there is a source that stores hundreds of data. Where is your data source? You have a few mainly known options as data source: SQL Server, MySQL, PostreSQL, Oracle… The Access authorization belongs completely to IT personnel and they are pretty stingy to put these resources into your service –they have justifiable reasons I’ll give you that. Thus, for your various tryouts in the first stage you need to use data sources that can be found online. Kaggle.com is a good website for that.

I myself downloaded this dataset that is about Udemy courses from Kaggle so that you can follow the same steps with me easily. This information about Udemy courses is found in this dataset: Name of the Course (course_title), publish date (published_timestamp), link of the course (url), payment status (ispaid), Price (price), main subject (subject), course level (level), duration of the course (content_duration), number of lectures (num_lectures), number of subscribers to the course (num_subscribes), number of reviews (num_reviews). Because aren’t we all tired of COVID!

2- Connect to the Data Source

When you open BI Desktop you will see the title Get Data under the Home tab. It is attached right next to the most-used in that field. You might have noticed that you can also connect Excel directly. Here we click on Get Data and choose the Text/CSV title. Power BI asks you “Do you want you use this data directly or do you want to use it by making some changes?” every time you import data. I would like to say “I trust my data and choose to import it directly.” but I see that there is a bad data input on the ispaid column, for this I choose Transform. By the way as you can see it divided the .csv extension file itself by detecting the separators.

get data and transform

3-  Edit the Data 

We will be editing on the ispaid column in our data. The information on the column is given with the true/false expressions. We will be changing them as Paid&Unpaid and we will also filter a cell that has nothing to do with either of them.

Change the Data type 

Data type is very important when it comes to data editing. The data type of the ispaid column that we will make changes on is Binary. To be able to change the expressions as Paid&Unpaid we will change its data type as Text. Power BI arranges the data type first every time it imports data and since we are making data type changes after this step it asks “Do you want us to save it as a new step?” At this point it doesn’t matter which one you choose, I requested it to add it as a new step.binary to tezt

 Change the Values

Now let’s change the true expressions as Paid and false expressions as Unpaid on this column. We achieve this with the Replace Values command which is under the Transform tab. Here there is also a value that has nothing to do with the existing expressions and starts with “http..”. We filter this value and make it invisible on the front face.

replace values

This is all that we will be changing on this data. Finally, we close it by choosing Close&Apply. If you want to make a change on the data later you can access this display again with the Transform Data title in the Home tab.

4-Charts

Add the card that shows the number of courses

It is always nice to have cards that have information about the data on the corners. I actually want to get the information of how many courses there are in total. For this I will make the values on the Course_Id Column counted singularly. I hold this title and drag to the report area. It immediately creates a chart for me. I change it with the image of card and indicate that the values on the course_id column will do the enumeration. I transfer it to top right corner.

card

Add the charts that show the number of courses by prices and total hours

Now we are creating a chart for the second information that I am interested in. We take the price and course_id columns to the report area. We change the chart type as clustered bar chart. To see the number, we active the Data Label under the Format. We change the Display units as None. You can see that the numbers are very high in this stage. Just like in the card we change the action as Count for the Course_ID column.

fiyatlaragöre kurs sayıları

We do an action similar to the one above for the hours as well. We change the Price as content_duration and add it to the report screen. We can copy the existing image for this.

saatlere göre kurs sayıları

Add the chart that shows the number of courses by subject and level

We take the subject and course_id columns to the report area. We change the type of the chart as clustered column chart. To show the number we activate Data Label under the Format. We change the Display units as none. In this stage too you will see that the numbers are very high. In order not to deal with the same situation with the other charts we click the course_id column on the column tab upwards and we choose Count(Distinct)[Count(Singularly)] on the Summarization area and we transform it to count the course_id column in our existing chart.

We take similar actions for levels as well. We change Subject as level and add it to the report area. For this too you can copy the existing image.

konularına göre kurs sayıları -2

Add the chart that shows the number of courses by spreading throughout years

About the other chart that we are going to be adding… I saw a published_timestamp column and wanted to use it. Let’s see to which year the highest number of publications belong. For this published_timestamp and course_id take the stage. This time we will use the stacked area chart. After creating this chart, you will see that some of the years are visible, not all of them. This is because the dates generally continue non-stop. In order to fix this and see all years in the chart we go to the format tab and get to the details of the X-Axis title. Here we change Type as Categorical.

Add a Table

Is our screen getting more complex or what? Don’t worry in the end it will not seem complex at all! 😎But for now, we will increase the chaos and do another action by adding a table. Here I saw the web links of the courses and thought that it would be nice for it to go there by clicking the link from the table. If we are on the same page here, let’s go.

Let’s take the columns that will exist in our table: url, course_title, subject, published_timestamp, num_lectures, num_reviews, num_subscribes. The main concern here is to define a field as URL. By choosing the .url column we change the Data Category in the Column tab as Web URL and the url in the table changes into the blue and underlined writing that we are all used to. By making another change we will change it into a symbol. We achieve this by activating the URL Icon button in the Values field under the format of the table.

tabloFundamentally we have added everything that we were going to. Now it is time to organize all this. For this you can follow two options. Since we don’t know the data here, we created charts to see what can come up. In another version if there are fields that come to your mind you can directly start with the visual arrangement.

5-Organize the Page

Spoilers

: From this point on people who enjoy messiness will be sad.

Logo is one of the main factors to make a report seem corporate. We download the logo of Udemy from the internet.

We import it in Power BI. We add the Udemy image by clicking on the Image option in the Insert tab. We usually put the logos on the top left corner, thus we can carry it there.

image ekle

Then we change the background of the page. We will use the code of F6F6F6 for the page’s background. In order for more columns of the table to be visible I change the page size from 16:9 to custom and make the height value 920. Afterwards I choose the Temperature theme that would be closer to the color of Udemy. After the theme all the colors in my charts become dark blue. I don’t want all of them to be same color. For this reason, I change the colors of two of them. You can achieve multiple selection with CTRL.

grafik rengi degistir

Then I change the places of the charts. We arrange the width of our card. We will put two clustered bar charts to the left and right corners and put other charts in between them. We will choose for the grey background to be seen in between the charts and arrange the width and the distance accordingly. After placing the charts for a nicer look, we will use round edges. For this we activated the Border field in the Format tab, change the color to white and maximize the radius.

grafikyeridegistir

Lastly, we give the last form to our table. I chose to close the left gap by making the column titles and the values and the width of the columns bigger. You can also add a small chart to the gap.

tablo

Aaand we are done! With all these steps by holding and dragging we created a fast and a basic report with Power BI. I hope that we haven’t lost anyone on the way while the article was flowing and that you liked it. I wish the best of luck to people who want to work on this report and improve it further, I am sure that there will be amazing visuals! I leave here a fast beginner-level link for you to take a look at our other articles about Power BI. Take care!

Good game well played

Power BI – 2020 May Favorites

Hello dear reader! Here we are with the Power BI May updates. Compared to last month, this month’s updates are a bit more superficial. But of course there are some subjects that stand out as always. Let’s go and start analyzing the Power BI May updates right away.

1-Apply All Filters

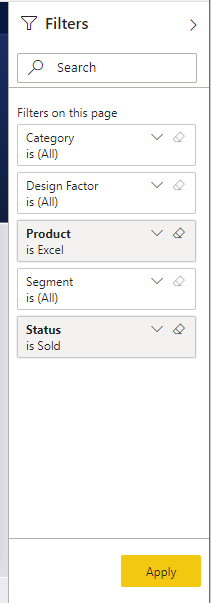
There is a new button in the filter field. What does this mean? It means that now we have some options while applying filters:

  • The report can change immediately in accordance with the values we choose on the filter field.
  • You can add Apply button to filter headers from the filter field. In this step, you need to press this button after making filter choices.
  • You can ad an Apply button that would apply all the filters at once on the filter field. First you do your filters on all the headers and than press this button.

You can access this new option by going to File > Options and settings > Options > Query reduction.


The necessity of it is arguable but to tell the truth, I know that it has been asked if all these new filter pane skills didn’t exist. So it is for sure that their existence will make some happy. By the way with this update we say goodbye to the old filter pane, bye sweetie.

2- Buttons Now Support Fill Images

A feature very convenient for people who want to use different images and shapes instead of writing an expression only. You can put different images to default, on hover, on press, and disabled options. You can access the option where you can use a button for this on the Fill field.


buton image

3-Drop Shadow Support for Visuals

I think this is the most prominent one of Power BI May updates. I am really happy to to have shadow effect! It gives dimension to the chart field and thus is very useful. Before, we arranged these shadowed fields on PowerPoint and than brought it to the Power BI background. By the way, there a lot of options like angle, transparency under the Shadow title. Since we don’t have to do this anymore, a wide range of people will be satisfied. ❤

shadow, gölge

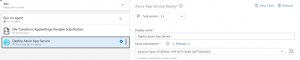
4- Conditional Page Navigation

Drill through option that was on preview is now generally available. Not only that, they also added conditional page navigation! This is a huge step. This means that you can show pages based on users! Let’s analyze its details all together. The main logic is that you need to enter the name of the page that will navigated by conditions into the DAX indicator.

5-Feature Table (Preview)

Actually it is one of the most interesting features of this month. Before, you had to download the Excel Analyzer extension to your computer that would run the Power BI data sets you were going to work on. After this step you had to download the data set connection. Now we can find the Power BI Dataset header on Excel. But for now, you have to have all the Office Insider programs to have this feature. I am waiting for the moment when we will be talking about it in detail when it is available for all users!

filtre butonu

6- New Data Source

  • Witivio

Witivio is an enterprise chatbot platform for employees with a deep integration in Microsoft 365 and the Power Platform. Without code, users can design and monitor chatbots for HR, IT HelpDesk and change management. Chatbot admins can track the usage and the performance of their chatbots to build advanced analytics.

You can find this connector in the Online services section of the Get data dialog.

  • Linkar Connector 

Linkar is a suite of components that facilitates efficient connectivity to MultiValue Databases. Linkar SERVER works with almost all MultiValue Database platforms centralizing connections and optimizing DBMS license usage. Client apps use Linkar CLIENT libraries to interact with the database through Linkar SERVER, with bindings for popular languages. This connector allows easy integration with MultiValue Databases through the Linkar platform.

You can find this connector in the Database section of the Get data dialog.

 Webtrends Connector

Webtrends Analytics is a Microsoft-preferred solution built from the ground up for the nuances of measuring performance of your website or SharePoint environments. This connector allows you to import your data into Power BI via our Data Extraction API (REST) with point and click ease. All reports on an individual profile are now available at once; no more limited report lists. The date range options have been expanded to allow standard report periods as well as custom date ranges. A customer account with Webtrends is required to use the connector.

You can find this connector in the Online services section of the Get data dialog.

Planview ProjectPlace connector

Get work done across projects and teams. Projectplace lets you plan, collaborate and track progress of all projects and assignments in an easy and user-friendly way.
This connector is supported by Planview as the preferred method of reporting on ProjectPlace moving forward. Existing users of the ProjectPlace connector should consider rebuilding their reports on this new, Planview maintained, certified connector.

You can find this connector in the Other section of the Get data dialog.

Shortcuts Business Insights connector

The Shortcuts Business Insights connector enables you to consume, read and analyze your data collected via your Shortcuts point of sale product of choice. Gaining access to this data will enable you to realize valuable business insights from your appointment, transactional, client, employee, product, and service data. These insights will allow you to better serve your customers and anticipate their needs, while growing your business to its full potential.

You can find this connector in the Other section of the Get data dialog.

Vessel Insight connector

Vessel Insight is a vessel to shore data infrastructure delivered as a service. The service enables shipowners, operators, and charterers to capture data from onboard systems such as propulsion, navigation, cargo, VDR as well alarm and engine management systems. Vessel Insight aggregates and contextualizes the data before transferring it to the cloud using the KONGSBERG Global Secure Network. The Vessel Insight Power BI connector makes it easy to integrate and combine vessel data with existing systems and streamline reporting and decision making.

You can find this connector in the Other section of the Get data dialog.

Zoho Creator connector

Zoho Creator is a low-code cloud software which lets you create custom applications for your business. Zoho Creator can collect data, automate business processes or workflows, analyze the data in reports, and collaborate with your application users. The Zoho Creator connector allows you to analyze data and share insights based off all data in Zoho Creator, aside from the pivot report.

You can find this connector in the Online services section of the Get data dialog.


Power BI may notable updates go like that! You can click here to download this month’s update. You can reach our other articles about Power BI here. Take care.

Good game well played.

What to Be Careful About In Online Interviews

With the restriction of socializing in the whole world, the human resources recruitment strategies will change significantly. So, how are we going to adjust ourselves to this?

As you know recruitment professionals carry the interviews online just like the other meetings in the work life. Let’s take a look at what to be careful about in online interviews, and the pros and cons of online interviews together. We should keep in mind that just like we get prepared before we go to a face-to-face interview, we should do the same before an online interview.

My first impression is that colors, outfit and body language make up the 55% and speech, tone of voice and emphasis make up 38%, and words and statements make up the 7%. Thus the first thing to draw attention in an online meeting would be our outfit and stance. Even though it is digital, we are going through a job interview so we should be professional. So, for that very reason, we should sit up straight and look at the camera while speaking. This way you will be making an eye contact. Dressing up suitable for the interview will give you confidence. Instead of wearing a shirt and a blouse only, don’t forget to wear a skirt or pants as well as a whole.

Don’t forget to adjust your camera before the interview. A good lighting and angle make a difference. Also having a simple and plain background will bring you into the forefront. If you are not going to be alone at home, you can let the others know that you will be in an online interview. Muting your cell phone is another part of the attention you pay.

The candidates having their resumes with themselves during the interview can be beneficial. There might me something that we forget or miss out on because of excitement. By this means, we can express ourselves more clearly. Likewise, we should not forget to smile as well. While answering the question it is important to be brief, clear and understandable. When the meeting ends we can make sure that the online interview is over and breathe a sigh of relief.

Before going through all these steps you can make a rehearsal with a friend. You can test sound and video system of your computer and your internet. You will have done the first preparation by being cautious in advance.

 WHAT ARE THE ADVANTAGES OF AN ONLINE INTERVIEW?

  • It is more favorable financially compared to face-to-face interviews. You can save time expenses like transportation.
  • Participation rate is higher than face-to-face interviews.
  • It is easier during the recruitment processes. Being outside of town is not a problem for the second interview.
  • As recruitment experts we don’t have to print out candidate’s resume, thus we prevent waste of paper. It is easier to share notes we took on digital with the related persons.


WHAT ARE THE DISADVANTAGES? 

  • You can come across technical problems like connection issues, lack of audio or video. While it increases our stress level, it also decreases time spared for us.
  • Most people might stress out in front of the camera and look more stressed than they really are. Recruitment experts carrying out the interview should be evaluating this situation well.
  • Using less body language like hand shaking, hand gestures etc. than face-to-face interviews.Unfortunately we cannot highlight our body language in these interviews.

You can click this link to get detailed information about our IT Recruitment Services.

Best Careers For Zodiac Signs and Recruitment

We see that each day a new approach emerges in human resources management. When it comes to choosing candidates there is no scientific approaches; intuition is the most important tool that the employers have. And a new approach is using zodiac signs in human resources management. In recent years, an insurance company in Salzburg, Austria advertised in the newspapers that sales and management department personnel of Capricorn, Taurus, Aquarius, Aries and Leo zodiac signs will be employed. In countries like the USA, Australia, Canada where asking personal questions while recruiting is forbidden zodiac signs are used to obtain information about characteristics of candidates. Nowadays in many countries human resources specialists don’t forget to check zodiac signs and it has become very common to work with astrology. Actually, there are companies that give this service. Jwalant Swaroop from Happy Ho stated: “We had clients who used astrology to choose senior candidates, including IT companies.” If this trend becomes a practice, candidates might start to mention their zodiac signs in their resumes soon. Don’t get surprised if you see zodiac signs in job advertisements.

And now we can talk about job-related features of zodiac signs and which professions are best for them 😊

Aquarius (January 22 – February 19)

Aquarius are known for being fond of their freedom. It is the cleverest of 12 signs. Its humanist nature sets Aquarius apart from the others. They act with logic. Aquarius who loves to renew itself is successful especially in professions in the technological area. Working home-office would be very convenient for them considering their need of movement and freedom. The Aquarius loves to explore innovative ideas and is very curious. It can be said that the Aquarius that is mostly found in non-conventional professions is the sign that is least suitable for the corporation life. Convenient areas for you: IT, Engineering, Computer Technician, Astrologist, electric electronic .

Pisces (February 20- March 20).

The most prominent feature of Pisces is being emotional and change. They are not that ambitious. They are very nice to others, suitable for teamwork and also have very strong intuition. They are not successful at jobs that require authority and harshness. They have the best imagination and can be successful at art. Intuition and help oriented jobs would be better for them. Areas for Pisces: Psychology, physiotherapy, nurse.

Aries ( March 21 – April 20) 

Aries is suitable for high-energy jobs. It is a full of life, active, competitive and ambitious sign that can’t tolerate losing. They are a leader from birth, they don’t like to work under orders. They are very suitable for being managers thanks to characteristics like deciding right away, organizing people and being punctual. Suitable areas for Aries: Marketing, Sports trainer, manager, soldier, entrepreneurship .

Taurus (April 21- May 21)

Taurus is calm, unaccommodating and cautious. The Taurus who don’t like to take risks or get out of their comfort zone are interested in safe and guaranteed jobs. It is one of the signs that are loyal to their jobs. Determined, patients and organized Taurus is one of the most well adjusted people in the workplace and make great teammates. They can work in any position from leader to follower. Also serious, patient, ambitious but intolerant, strict managers might turn out to be a Taurus. Suitable areas for Taurus: Banking, stock market, purchase and sale, real estate.

 Gemini (May 22- June 22)

Gemini are more prone to dynamic jobs. They don’t want to do boring and routine jobs and desk jobs are not the best for them. Jobs requiring trips are very suitable for the Gemini. They are really good at language learning. They are excellent candidates for key positions abroad or jobs that require communication and a social circle. Suitable areas for Gemini: journalism, advertisement, translation, social median expert.


Cancer (June 23- July 22)

The Cancer is very compassionate. They are one of the most humanist signs and love to take care of people. From the perspective of carrier, they are creative at solving problems and giving advises. Suitable areas for Cancer: Human resources, psychology, kindergarten teacher.

Leo  (July 23 – August 22) 

Leo loves to work at jobs that bring along a title and strength. They are not the best team players to be honest. Courage and domination is their most prominent features. They are always honest and right. Even though they are preferred by any profession because of their strong royalty, because of their bossy aura they have a hard time in positions apart from senior executors. The Leo prefers to  choose  respected jobs in private sector. Suitable areas for Leo: Management, organization management, CEO, director.

Virgo (August 23 – September 22)

Virgo pays attention to the smallest details and are perfectionists in the working life. They see the details that nobody else does. They like to analyze their work really well. They don’t work with assumptions, they act with logic. It is one of the most disciplined signs. Suitable areas for Virgo: Mathematics Engineer, IT, accounting, banking, architect.

 Libra (September 23- October 22)

Libra loves to bring people together. Giving attention to human relations and working with others make them happy. They achieve success in the service sector and human relations. And jobs concerning aesthetics are for them. Areas suitable for Libra: Travel agent, costumer representative, aesthetician, public relations.

Scorpio (October 23- November 21)

Scorpio has a very important place at work with its strong willpower, ability of moving on after the truth without giving up and with its deep-thinking character. They love to challenge and research. They are a bit of control freaks. The biggest disadvantage of Scorpio at work is  skepticism. They have a very hard time trusting. Especially jobs that require skepticism, detailed research are suitable for the Scorpio. Suitable areas for Scorpio: Manager, detective, scientist, archaeologist, crisis and finance management

Sagittarius ( November 22 – December 21)

Just like the Taurus, Sagittarius are one of the best team players. They are well adjusted. They get along well with their managers, they are extroverts. They can deal with stressful situations easily. The full-of-energy Sagittarius loves to learn and travel. Field jobs can satisfy the Sagittarius. They are very successful at sales thanks to their persuasive skills. Suitable areas for Sagittarius: Public relations, sales experts, marketing, import-export foreign trade expert.

Capricorn (December 22 – January 21)

Capricorn is the most workaholic of all 12 signs. They don’t run away from responsibilities, they are authoritative and disciplined. If they have a goal, they work ambitiously without paying attain to obstacles. They make amazing managers.   They were born to be a CEO. Doesn’t matter the sector, the Capricorn will be very successful as a manager with its strategy-producer and planner characteristics. Since they have the leadership qualification they are wanted  in organizations as administrators. Suitable areas for the Capricorn: CEO, Banking, Computer Engineer, any profession about IT.

We Welcomed the Webrazzi Team at our Office

We welcomed the Webrazzi team that visits important enterprises and technology centers in Turkey for the second time, this time at our new office. You can watch the program that we recorded in February.

Microsoft Office 365 May Updates

A New Meeting Experience with Microsoft Teams

Soon Microsoft Teams meeting will be opened in a separate window than the main Teams screen! Also the control bar on which turn off camera/mute, raise hand, chat, leave meeting options are found will be located on top of the screen. This way the meeting image on the background will not be blocked. The place of control bar was one one the features that got a lot of negative feedback.

And let’s not forget to mention that in the new meeting experience there are 9 3×3 screens instead of 2×2, with the raise hand feature you can send a visual signal that you have something to say and that we can upload our own backgrounds in addition to the recommended backgrounds.

Adding Online Meeting Option to All Meetings

Another feature coming to our online meetings is having the option of adding “Online” option to all meetings as default. When this feature is activated Outlook Web, Outlook Mobile (iOS and Android) Online meeting option will be added for all Teams and Skype for Business meetings. This feature is not compatible with 3rd Party online meeting applications. If users don’t activate this option, they will add the Online option manually each time they setup a meeting.

Chat and Meeting Between Teams and Skype Consumer

Skype Consumer and Teams working together is one of the most requested features. Finally users in the organization and Skype users can have a meeting and chat. This feature has been on External Access page of Teams Admin Center, now it will be available for active use.

With the “Pre-publish” option located on the right part of the SharePoint screen it will be possible for the page editors to analyze how page will look after being published and edit if necessary with the preview option before publishing.


Inviting Office 365 Group of Distribution List to Teams Meeting

It will be possible to invite everyone in a Teams team or Distribution List while setting up a new Teams meeting. This way groups/lists will be added as an individual or invitation will be sent to everyone in the group/ list. without setting up a meeting inside the channel.

Outlook Web – “Send later”

Soon it will be possible to send e-mails written on Outlook Web later with the “Send Later” option. This feature will come among the Outlook rules and it will be possible to apply this feature in mass.

Microsoft Stream Screen Recording

Finally screen recording is going to be available for Stream! Now it is possible to recorde a window or the whole screen and making it professional by adding microphone, sound and webcam options. You don’t need to download any applications, you can you use this feature with the latest versions of Edge or Chrome browsers.

Office.com Main Page Layout is Changing

Now the layout of Office.com portal starts with the option to create a new document with “Start New”, and continues with a horizontal list of our most important applications. New portal is going to be symbolically moved to left vertically.


Background Policies in Teams Meetings

Now there is an update concerning Teams Admins. Soon we will be able to control new features like blurring or changing background by assigning user based policies. For example we can allow some users to add custom pictures and some to just blur. Policies will be under 4 main titles:

  • No filters are available.
  • Only background blur is available.
  • Background blur and default images will be available.
  • Everything is active: Background blur, adding custom images in addition to default images.

SharePoint Spaces Preview

SharePoint Spaces is a web-based platform, which lets you create structures, themes and backgrounds to which they can add web parts and that contain 3D objects, 360° images and videos, 2D images and texts. 3D results can be watched in the web browser or mixed-reality headset.


Sputnik Radio “Corona Diaries”

Our COO KadirCan Toprakçı appeared as a guest on the “Corona Diaries” program presented by Serhat Aydın on Sputnik Radio. In this broadcast that we talked about our Digital workplace platform Velocity, we talked about our global success and solutions that we offer.

Things to Pay Attention to while Migrating a .NET Framework Project to .NET Core

At PEAKUP there is a new “Data” project that we have developed a long time ago in order to provide some data that our own products need from one center instead of keeping it app based. First of all, I want to talk about what the application does and what it contains. We started to develop the project with .NET Core when it first came out and then migrated to .Net Framework to wait a bit more till .NET Core becomes a bit more stable. The data base was designed completely with EntityFramework Code First. We use Azure SQL Server as database. This application alongside the geographical information like continent, country, city also has information that is needed in pretty much any application like 2020/2020 Public Holidays, current weather condition and exchange ratesThere are also 2 more Azure Job Projects that connects to more sources and registers data for weather forecast and exchange rates and registers them to both the database and Cache in order to give faster outputs with Redis alongside the web app that we use for the presentation of data in the server 

Why are We Migrating to .Net Core? 

 First of all, when we take a look at Microsoft’s development efforts for .Net Core and what is going on, it is not hard to foresee that in the long term the developments for .Net Framework will stop after some time of they will be restricted. It is obvious that some stuff I will talk about are possible with .Net Framework as well, but they are not as good as .Net Core for sure and that some problems come up and cause extra time-loss.

Seeing the libraries for features like Image Compression, Video Compression that we want to add to the Project soon are only developed by .Net Core is very important when it comes to cutting the effort for the long-term developments in half.

A big increase in the weather forecast and exchange rates data is observed while the number of users in other PEAKUP products who send request to the application increase. Taking precautions for the upcoming problems of the increase in Response time as the number of requests to the app and data size increase, and web app we use and SQL data base becoming a problem in terms of cost and performance are among the most important reasons.

For now we keep the project in two different Git Branches. We do the developments on Dev, after seeing that everything is okay we merge it to Master and run all the Deployment activities manually during this process. Even though it is not a project that we open and work on frequently, this process being out of manually deployed situation with Azure DevOps and the feature of automatically deploying and running Migrations on database on its own is a development we desire. Doing this more efficiently and faster with .NET Core is more flexible because package management in the project is designed in an easier way.

We used to switch between Azure Service Plans to scale unusual load the customers who changed to apps as SaaS by PEAKUP got when they completed the process once and announced the products to their users. This causes some restrictions on the side of  Azure Web Application in terms of costs and scaling the application.  The app moving to Containers completely thus Scaling Down itself and run limitless Containers and responding all the request with the same speed or even faster in case of need with Azure DevOps was one of the features we desired. After the tests I did after I migrated the project, I saw that it was too early for the steps concerning Docker and Kubernetes and decided to continue with the web application.

Problems I came across and their Solutions 

  • Change in Routing

I started to foresee how achy the migration is going to be when I came across this problem that I spent almost half a day on. There were two GET methods we used in the Interface design in the project and one of them routed all the records and the other routed the data as to Id parameter it got. I researched and found out that it is not allowed yet to prevent faulty designs concerning Routing on .Net Core. For this I decided to continue with a method that acts differently on each occasion by nulling the Id parameter in the method.

  • Different Names in Entity Framework Core 

I used all the models we used while developing the project while switching to .NET Core. I was sure that Schema that was going to be on database thanks to Auto Migration was going to be the same but I saw that while domain names where relationships are established on .NET Framework didn’t go through any changes between the areas used for relationships, on .NET Core underscore was added. For this to set up Schema as it is and to migrate the data on Production directly, I utilized the [ForeignKey(“X_Id”)]  attribution to make the data on the column suitable with the old standards.

  • Database Migration

I imported a copy of around 12GB data to a server on Azure without losing any data on the database. From there I took a data around 12GB that I zipped and downloaded to my computer to my device as a 900MB text and started to try scenarios concerning data migration. Weather, Forecast and Currency tables were the main reason of size being that big. For this I decided to move on by migrating these three tables one by one. I can say that between the scenarios I tried, I did benchmarking in SQL, so to speak.

Even though I ran the file I imported completely on a database and then provided data entry, these actions took too long and after a while if there was a mistake all the time I spent would turn to dust. Therefore I chose the Import Data option that came as default in SQL Management Studio to migrate each line one by one and to see the consistency between the Schemas on two different databases. In this step I saw that Entity Framework created the the data type difference of datetime on .NET Framework and datetime2 on .NET Core.

I went back to the project and added the [Column(TypeName = “datetime”)] attribute in the beginning of the Datetime fields and made sure that it stayed that way for the data migration on Schema and imported it successfully to my device in 15 minutes.

To run an EF Core database on Production I deployed both the data base and the application by opening the Web Application. I decided to go on with the Linux Web Application I used for .NET Core and then had some problems. I talked about them in the upcoming steps.

  • Library Change on the Cache Layer

We used to use the ServiceStack.Redis library that had a better performance and API design and that offered a cache memory solution with a higher performance with its specially developed JSON library. But since the Nuget library on which we did this development hasn’t been updated for a long time thus we stayed away from this benefit and we didn’t see its performance concerning Connection Pooling I changed to Stack.Exchange.Redis Library developed by StackOverFlow.

  • Critical Lacks in Text. Json

I can say that Microsoft has been obsessed with developing System.Text and all libraries under it for  performance and JSON actions of .NET Core for a long time. I have been following that there is an increase of performance in almost all Framework versions in a lot of projects that use System.Text Namespace when benchmarking tests are done. I thought and guessed that a library coming from Built would be better in JSON’s routing in API to get rid of Newon.Json’s and ServiceStack.Redis’ JSON library  data reading-writing to Cache. But than a huge disappointment waved at me! Cause I saw in the Microsoft Document published about migrating from Newton.Json that many features like PreserveReferencesHandling, ReferenceLoopHandling haven’t been developed.

  • Features in Linux Web Application that haven’t been completed on Azure

First I ran the application in a standard way that I can manually test and then run performance test without waiting for a Pipeline and to continue after Staging. I started the action by publishing and came across a 1-hour disruption on Azure by chance and thought that there was something wrong with the application. After losing two hours I found out that there was an incident on Microsoft and some issue might occur on the European continent that we work on. At that point I started to work on the next steps on the application. And I realized that the disruption was a blessing!

Some of the data we import concerning exchange rates and forecast flow instantly and some of them flow hourly. We dealt with them without leaving the job as Azure Job before anyways. I couldn’t find the Web Job tab inside the Web Application to observe some problems about it staying the same way and what will happen! First I thought it might have to do with the Tier of the application so I moved to an upper Tier and Web Job didn’t come back.  Then when I did some research I found out that Linux type Azure Web Applications lacked a lot of things. Without waiting for the disruption to be over I deleted the application and continued by opening a new Windows type web application.

The reason I made that decision had to do with the structure continuing through Kubernetes and Container depending on the success of Load tests.

  • Load Testing  

There is a paid and an unpaid tool developed by the engineering team of SendLoop know by everyone as an e-mail marketing company. I always wait for the first test to go through here with this tool that you can reach on https://loader.io/ and then do the load tests with EU project of Apache. The first test with this tool that goes up to 10.000 requests was pretty successful. A serious decrease was seen in response time but after a while the application would start to slow down.

I realized that there was an unreasonable expansion in Memory in Web Application and that after a point there was no space even a space of 1 MB. When I analyzed the requests I saw that the method I used was going on with AddAndWrite scenario instead of OverWrite on the given Key of data! I solved this problem right away and continued the tests after upgrading the packages.

After I saw that requests passed successfully on SendGrid I started to do tests with the EU Tool. For this I used a server that had a very good internet connection. Now everything is ready and I can move on to the last step on DevOps.

  • Changes in DevOps Pipeline Setup 

After I turned the project into a condition that received requests, I started to separate it into three Stages: Production that I talked about in the beginning of the article, Beta that works with a live environment and code development and DEV. First I completed the migration in a way that Master, i.e. Production would follow the sequence.

And I came across an interface change Azure did on DevOps Pipeline. I found out that the infrastructure of the library i.e. changes done concerning ConnectionString, special keys etc. are added as a Step while  migrating Artifact output to the Release step with a Versioning system now.