Hello dear reader! We only need to enjoy these warm days as the summer comes to an end they days become shorter, but isn’t it just WAY TOO HOT? With Power BI 2020 August updates, visualizations come to the forefront with the new images added to the marketplace. Apart from that, there are new collaborations with new resources and some additions to the existing features. You can download the update here.

1-Perspectives support for Personalize visuals
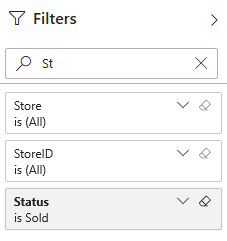
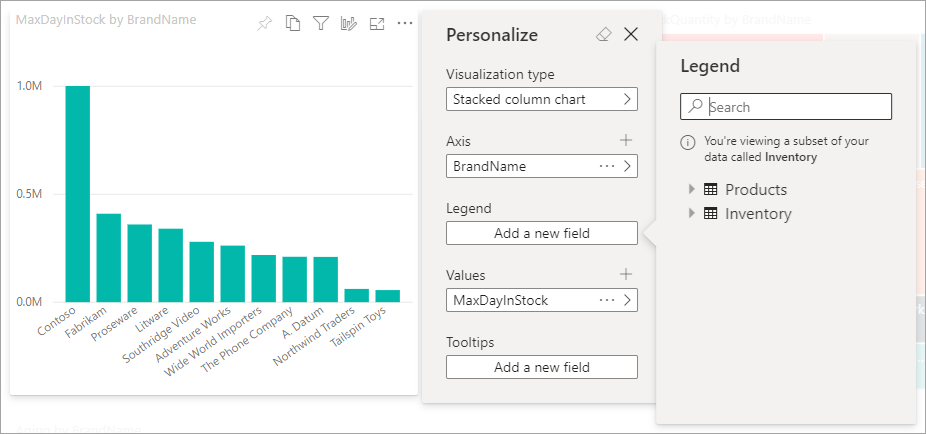
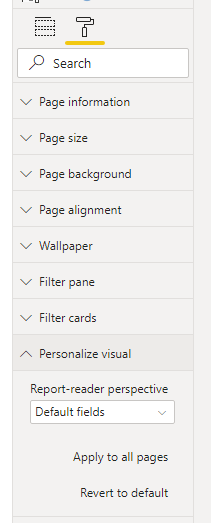
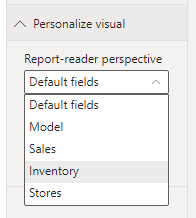
As a refresher, Personalize visuals is a preview feature that will allow your end-users to make tweaks to visualizations in the reading view. For example, your end-user can change a measure or dimension or add a legend. Previously, if you had a large data model, there was no way to pick a more manageable subset fields to not overwhelm your report readers with all fields in the model. Now, in this release we are adding Perspectives support for Personalize visuals, which will allow you to choose a subset of a model that provides a more focused view.
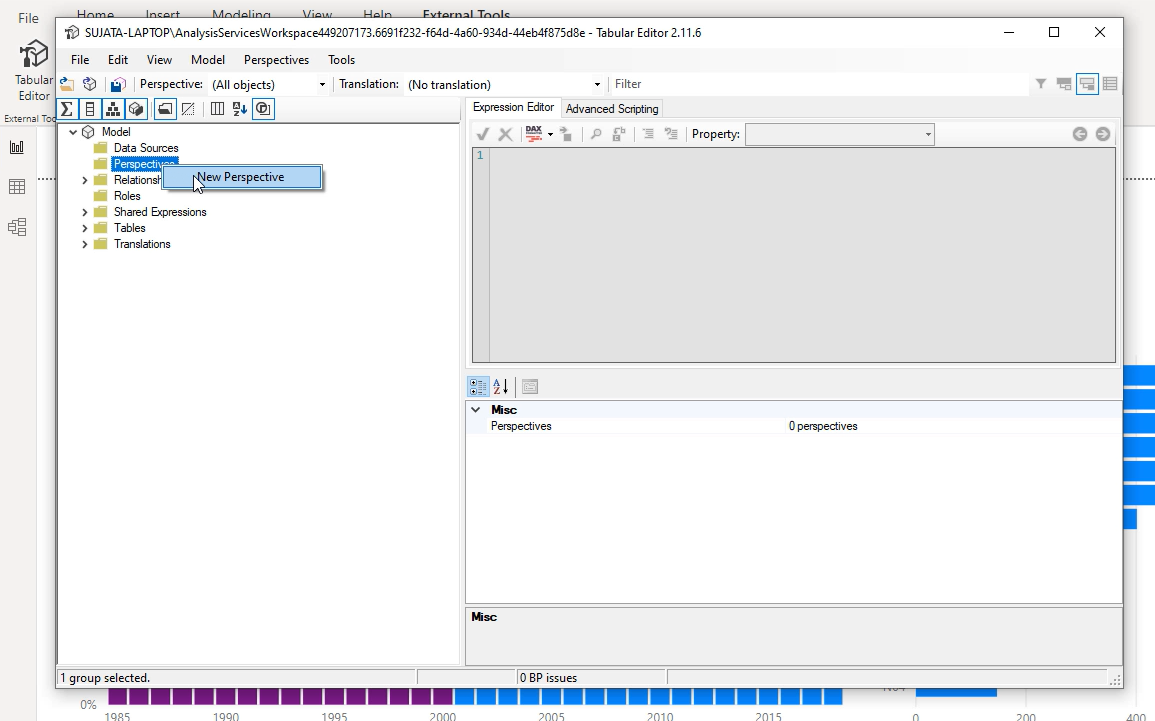
 The hard thing is here for the user to make the correct decision. For this, we will use on of the tools developed for Power BI: Tabular Editor. As well as you can use these tools directly, you can already add them under a tab on Power BI Desktop. You can check the 3rd title here for more details.
You will need to right-click on Perspectives folder to create a new perspective:
Next, you will need to add fields to the perspective. You can do this by opening the Tables folder and right-clicking on the fields you want to show in the perspective:

Repeat this for all the fields you want to add to the perspective. Note that you can’t add duplicate fields to a perspective so if you already added it to a perspective you will see the option for that perspective is disabled.
After you have added all the fields be sure to save both in Tabular Editor and then also in Power BI.
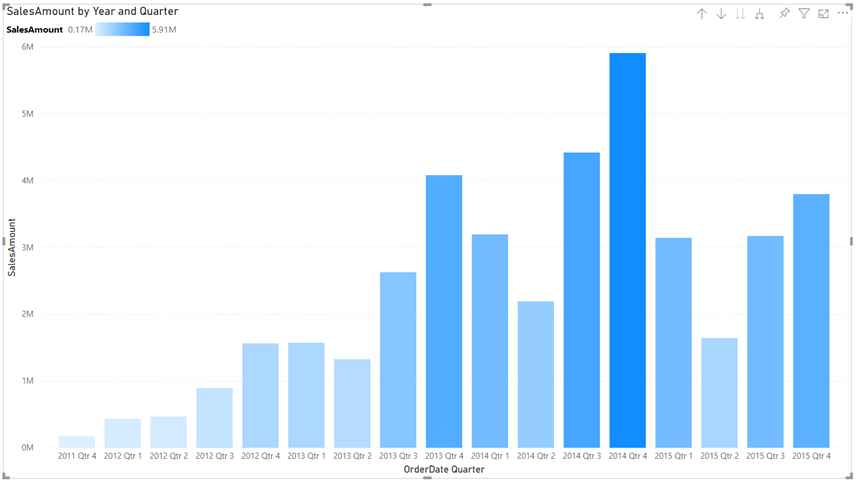
2- Rectangular lasso select for data points
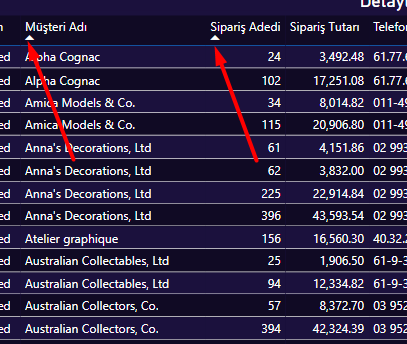
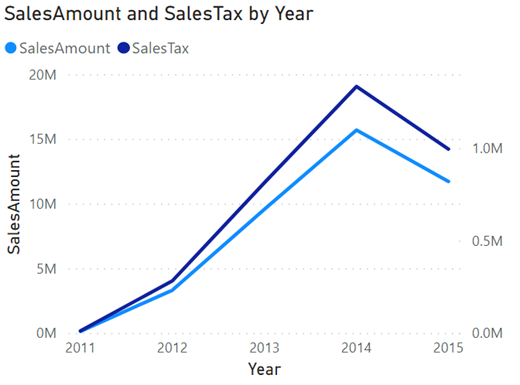
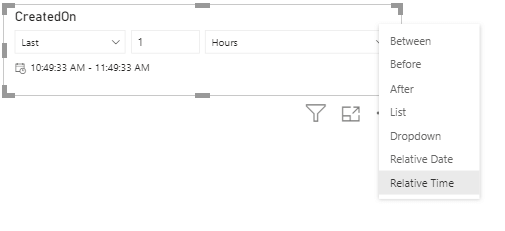
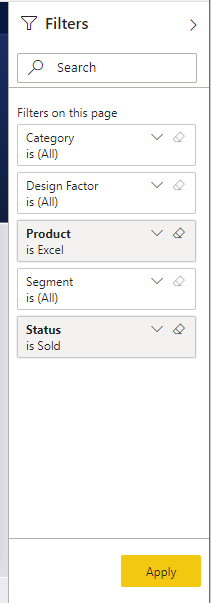
Another one of the Power BI August updates is the Rectangular lasso select. We were very happy about the rectangular lasso select. Now it is available for the data points in charts as well. You can select the point in the chart you want with CTRL and filter them. And you can add other points to the point you’ve selected with the Shift key.
3- New Visualizations
- Progress Bar

- Pie & Donut Chart

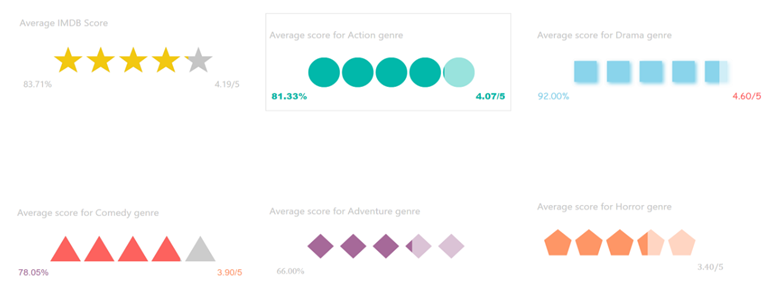
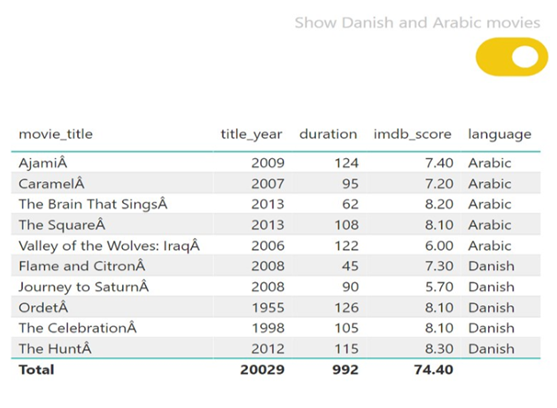
- Rating Visuals
- Toggle Switch
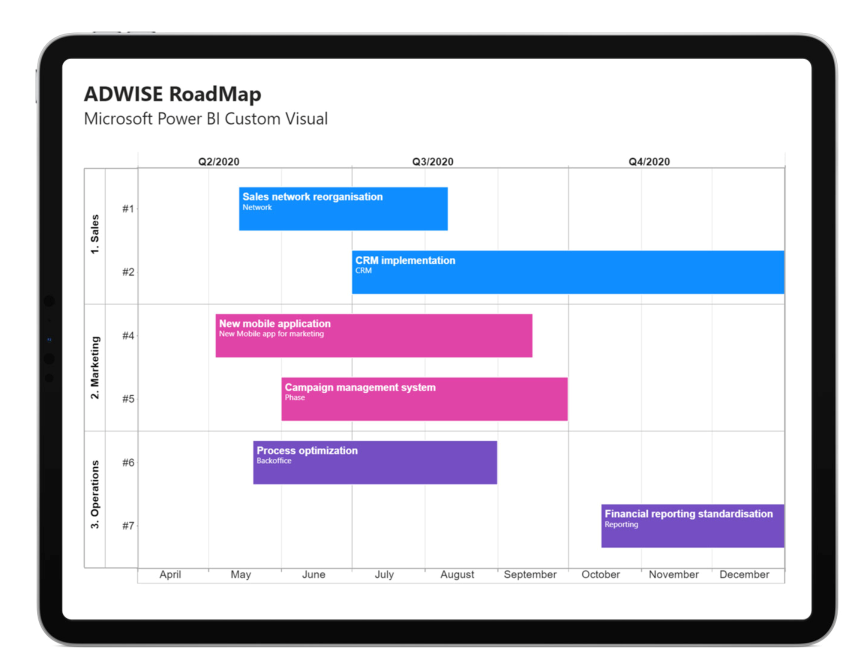
- RoadMap
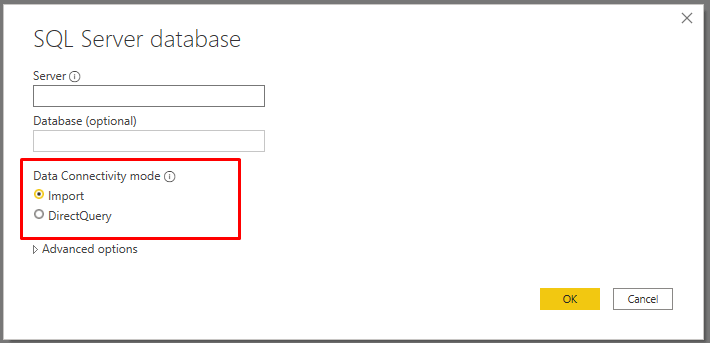
4- Data Connectivity
Cherwell connector
CSM 10.0 enables real-time collaboration and accelerates incident resolution.
Automation Anywhere connector
Automation Anywhere is a leading Robotic Process Automation (RPA) platform that enables automation of Enterprise business processes. The Power BI connector from Automation Anywhere enables a business user to easily integrate RPA data in their corporate Power BI dashboards without relying on IT resources to create custom integration solutions. The Power BI connecter can retrieve operational, strategic and business metrics from Automation Anywhere’s RPA platform.
Acterys connector
is an integrated platform for Data Warehouse Automation, Corporate Performance Management (CPM) and Financial Planning & Analytics (FP&A) for Microsoft Azure, Power BI and Excel.
It enables users to achieve results in minutes, and replace disparate legacy solutions with a single, cost effective and unified platform for all their analytics, planning, forecasting, consolidation and project planning requirements. With the new Acterys Power BI Connector users can now connect to their Acterys environment with one click (without the need to access the database directly or setting up a Power BI dataset) and add the required models to Power BI governed by their Acterys (Active Directory/ Microsoft Account) user rights and audit trails.
So much for this month’s updates. See you in our next article.
Good game, well played.