Hello dear reader! Here we are with the Power BI May updates. Compared to last month, this month’s updates are a bit more superficial. But of course there are some subjects that stand out as always. Let’s go and start analyzing the Power BI May updates right away.

1-Apply All Filters
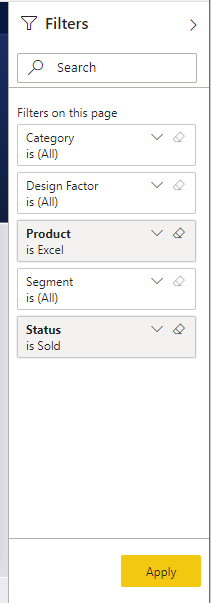
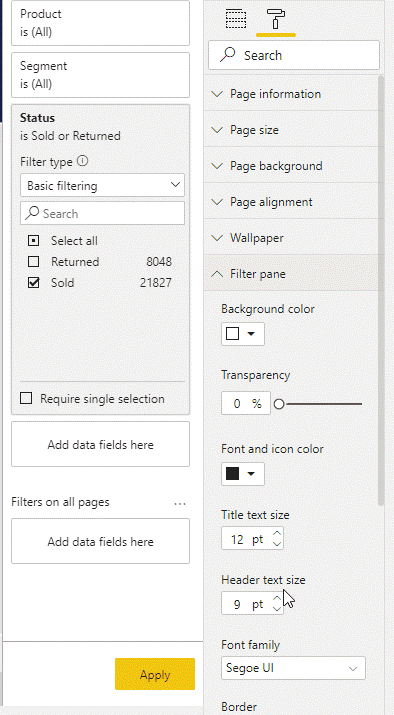
There is a new button in the filter field. What does this mean? It means that now we have some options while applying filters:
- The report can change immediately in accordance with the values we choose on the filter field.
- You can add Apply button to filter headers from the filter field. In this step, you need to press this button after making filter choices.
- You can ad an Apply button that would apply all the filters at once on the filter field. First you do your filters on all the headers and than press this button.

You can access this new option by going to File > Options and settings > Options > Query reduction.

The necessity of it is arguable but to tell the truth, I know that it has been asked if all these new filter pane skills didn’t exist. So it is for sure that their existence will make some happy. By the way with this update we say goodbye to the old filter pane, bye sweetie.
2- Buttons Now Support Fill Images
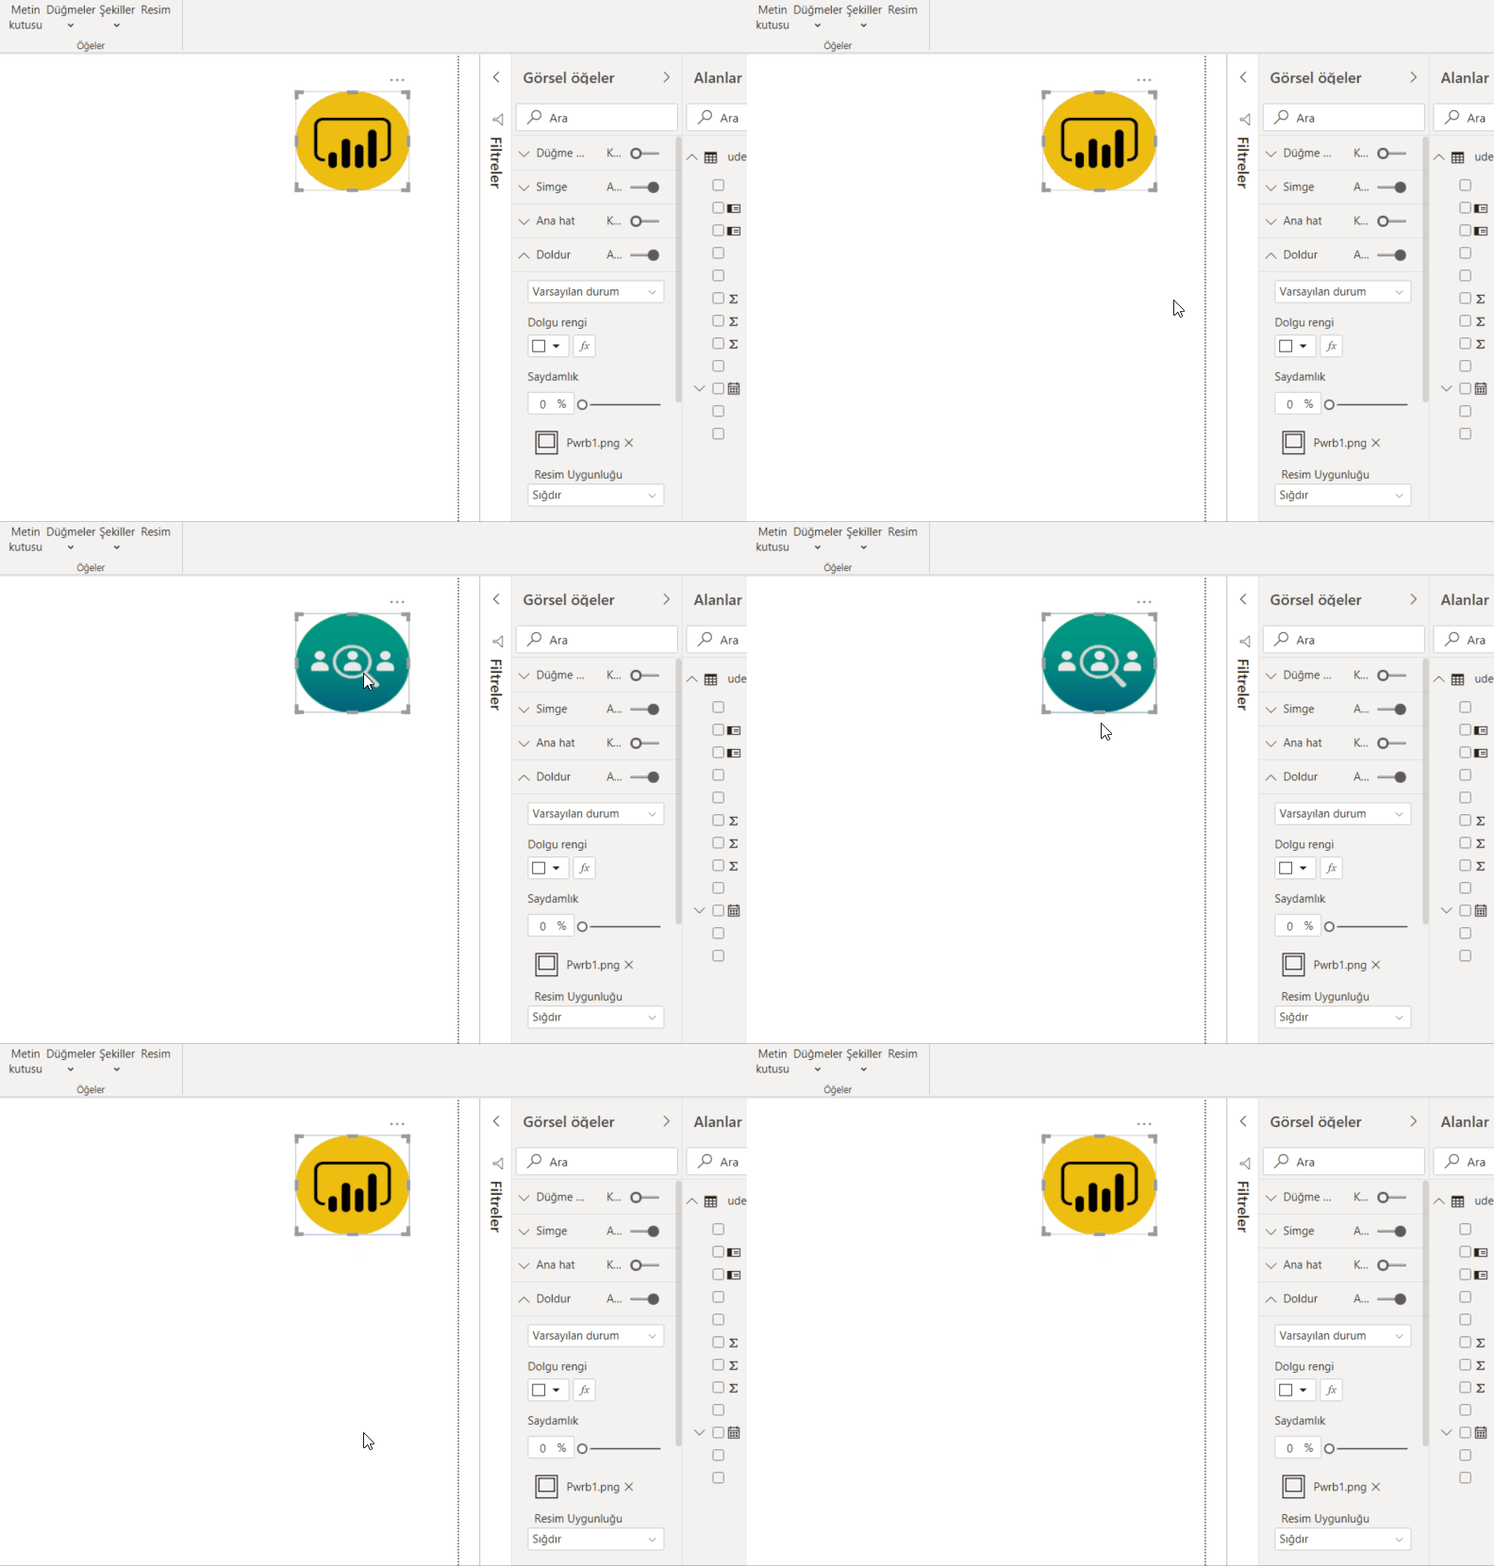
A feature very convenient for people who want to use different images and shapes instead of writing an expression only. You can put different images to default, on hover, on press, and disabled options. You can access the option where you can use a button for this on the Fill field.

3-Drop Shadow Support for Visuals
I think this is the most prominent one of Power BI May updates. I am really happy to to have shadow effect! It gives dimension to the chart field and thus is very useful. Before, we arranged these shadowed fields on PowerPoint and than brought it to the Power BI background. By the way, there a lot of options like angle, transparency under the Shadow title. Since we don’t have to do this anymore, a wide range of people will be satisfied. ❤

4- Conditional Page Navigation
Drill through option that was on preview is now generally available. Not only that, they also added conditional page navigation! This is a huge step. This means that you can show pages based on users! Let’s analyze its details all together. The main logic is that you need to enter the name of the page that will navigated by conditions into the DAX indicator.

5-Feature Table (Preview)
Actually it is one of the most interesting features of this month. Before, you had to download the Excel Analyzer extension to your computer that would run the Power BI data sets you were going to work on. After this step you had to download the data set connection. Now we can find the Power BI Dataset header on Excel. But for now, you have to have all the Office Insider programs to have this feature. I am waiting for the moment when we will be talking about it in detail when it is available for all users!

6- New Data Source
- Witivio
Witivio is an enterprise chatbot platform for employees with a deep integration in Microsoft 365 and the Power Platform. Without code, users can design and monitor chatbots for HR, IT HelpDesk and change management. Chatbot admins can track the usage and the performance of their chatbots to build advanced analytics.
You can find this connector in the Online services section of the Get data dialog.
- Linkar Connector
Linkar is a suite of components that facilitates efficient connectivity to MultiValue Databases. Linkar SERVER works with almost all MultiValue Database platforms centralizing connections and optimizing DBMS license usage. Client apps use Linkar CLIENT libraries to interact with the database through Linkar SERVER, with bindings for popular languages. This connector allows easy integration with MultiValue Databases through the Linkar platform.
You can find this connector in the Database section of the Get data dialog.
Webtrends Connector
Webtrends Analytics is a Microsoft-preferred solution built from the ground up for the nuances of measuring performance of your website or SharePoint environments. This connector allows you to import your data into Power BI via our Data Extraction API (REST) with point and click ease. All reports on an individual profile are now available at once; no more limited report lists. The date range options have been expanded to allow standard report periods as well as custom date ranges. A customer account with Webtrends is required to use the connector.
You can find this connector in the Online services section of the Get data dialog.
Planview ProjectPlace connector
Get work done across projects and teams. Projectplace lets you plan, collaborate and track progress of all projects and assignments in an easy and user-friendly way.
This connector is supported by Planview as the preferred method of reporting on ProjectPlace moving forward. Existing users of the ProjectPlace connector should consider rebuilding their reports on this new, Planview maintained, certified connector.
You can find this connector in the Other section of the Get data dialog.
Shortcuts Business Insights connector
The Shortcuts Business Insights connector enables you to consume, read and analyze your data collected via your Shortcuts point of sale product of choice. Gaining access to this data will enable you to realize valuable business insights from your appointment, transactional, client, employee, product, and service data. These insights will allow you to better serve your customers and anticipate their needs, while growing your business to its full potential.
You can find this connector in the Other section of the Get data dialog.
Vessel Insight connector
Vessel Insight is a vessel to shore data infrastructure delivered as a service. The service enables shipowners, operators, and charterers to capture data from onboard systems such as propulsion, navigation, cargo, VDR as well alarm and engine management systems. Vessel Insight aggregates and contextualizes the data before transferring it to the cloud using the KONGSBERG Global Secure Network. The Vessel Insight Power BI connector makes it easy to integrate and combine vessel data with existing systems and streamline reporting and decision making.
You can find this connector in the Other section of the Get data dialog.
Zoho Creator connector
Zoho Creator is a low-code cloud software which lets you create custom applications for your business. Zoho Creator can collect data, automate business processes or workflows, analyze the data in reports, and collaborate with your application users. The Zoho Creator connector allows you to analyze data and share insights based off all data in Zoho Creator, aside from the pivot report.
You can find this connector in the Online services section of the Get data dialog.
Power BI may notable updates go like that! You can click here to download this month’s update. You can reach our other articles about Power BI here. Take care.

Good game well played.

