Hello dear reader! In this post I created a beginner-level guide for creating a fast report for people who never got to meet with Power BI but want to learn something about it or people who want to brush up on their information. We are talking about 18 minutes here. We cannot even get ready to get out of home in 18 minutes. 😂 If Power BI is not downloaded on your computer you can download the latest version here. Let’s start!

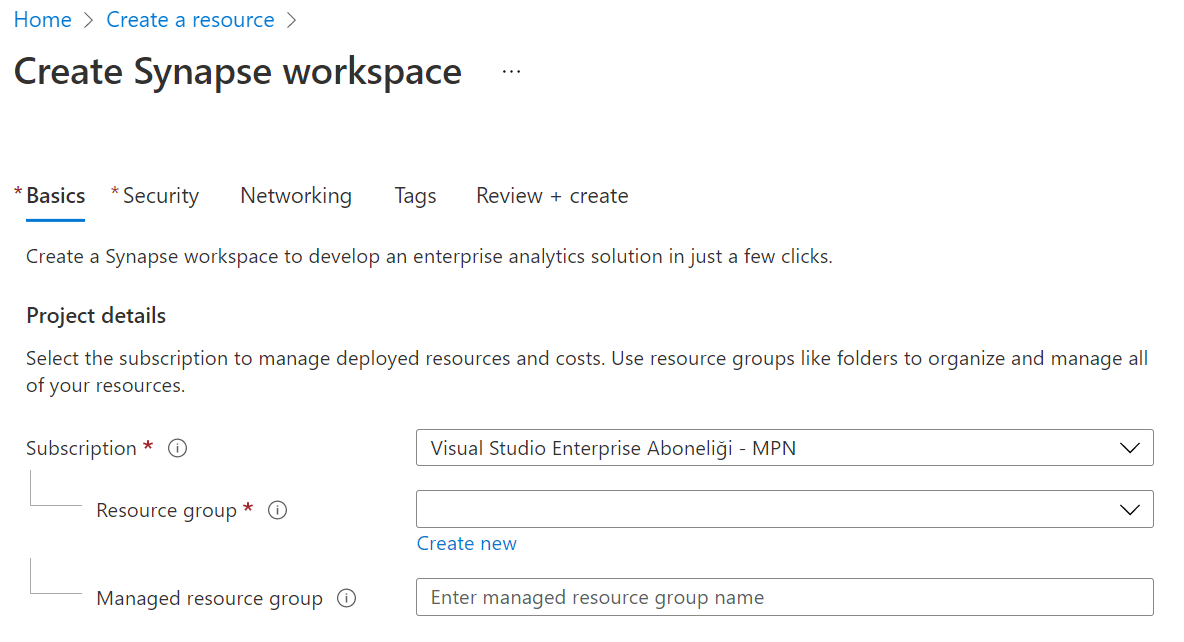
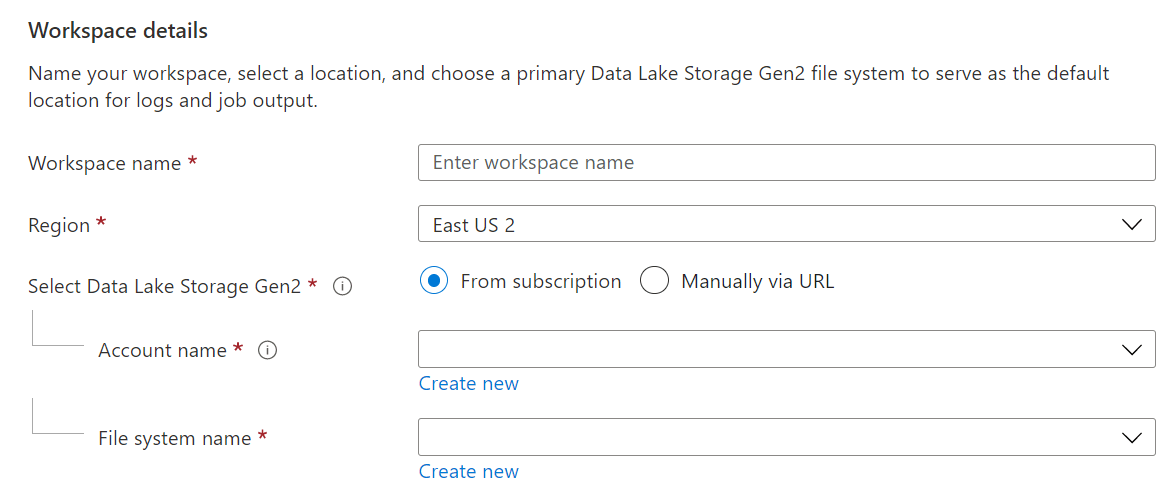
1- Where is your Data Source?
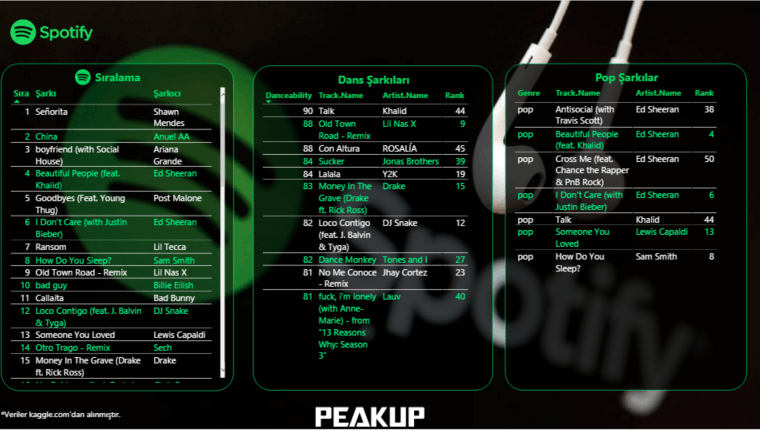
I thought it would be nice to start with a logical question since we know that there is a source that stores hundreds of data. Where is your data source? You have a few mainly known options as data source: SQL Server, MySQL, PostreSQL, Oracle… The Access authorization belongs completely to IT personnel and they are pretty stingy to put these resources into your service –they have justifiable reasons I’ll give you that. Thus, for your various tryouts in the first stage you need to use data sources that can be found online. Kaggle.com is a good website for that.
I myself downloaded this dataset that is about Udemy courses from Kaggle so that you can follow the same steps with me easily. This information about Udemy courses is found in this dataset: Name of the Course (course_title), publish date (published_timestamp), link of the course (url), payment status (ispaid), Price (price), main subject (subject), course level (level), duration of the course (content_duration), number of lectures (num_lectures), number of subscribers to the course (num_subscribes), number of reviews (num_reviews). Because aren’t we all tired of COVID!
2- Connect to the Data Source
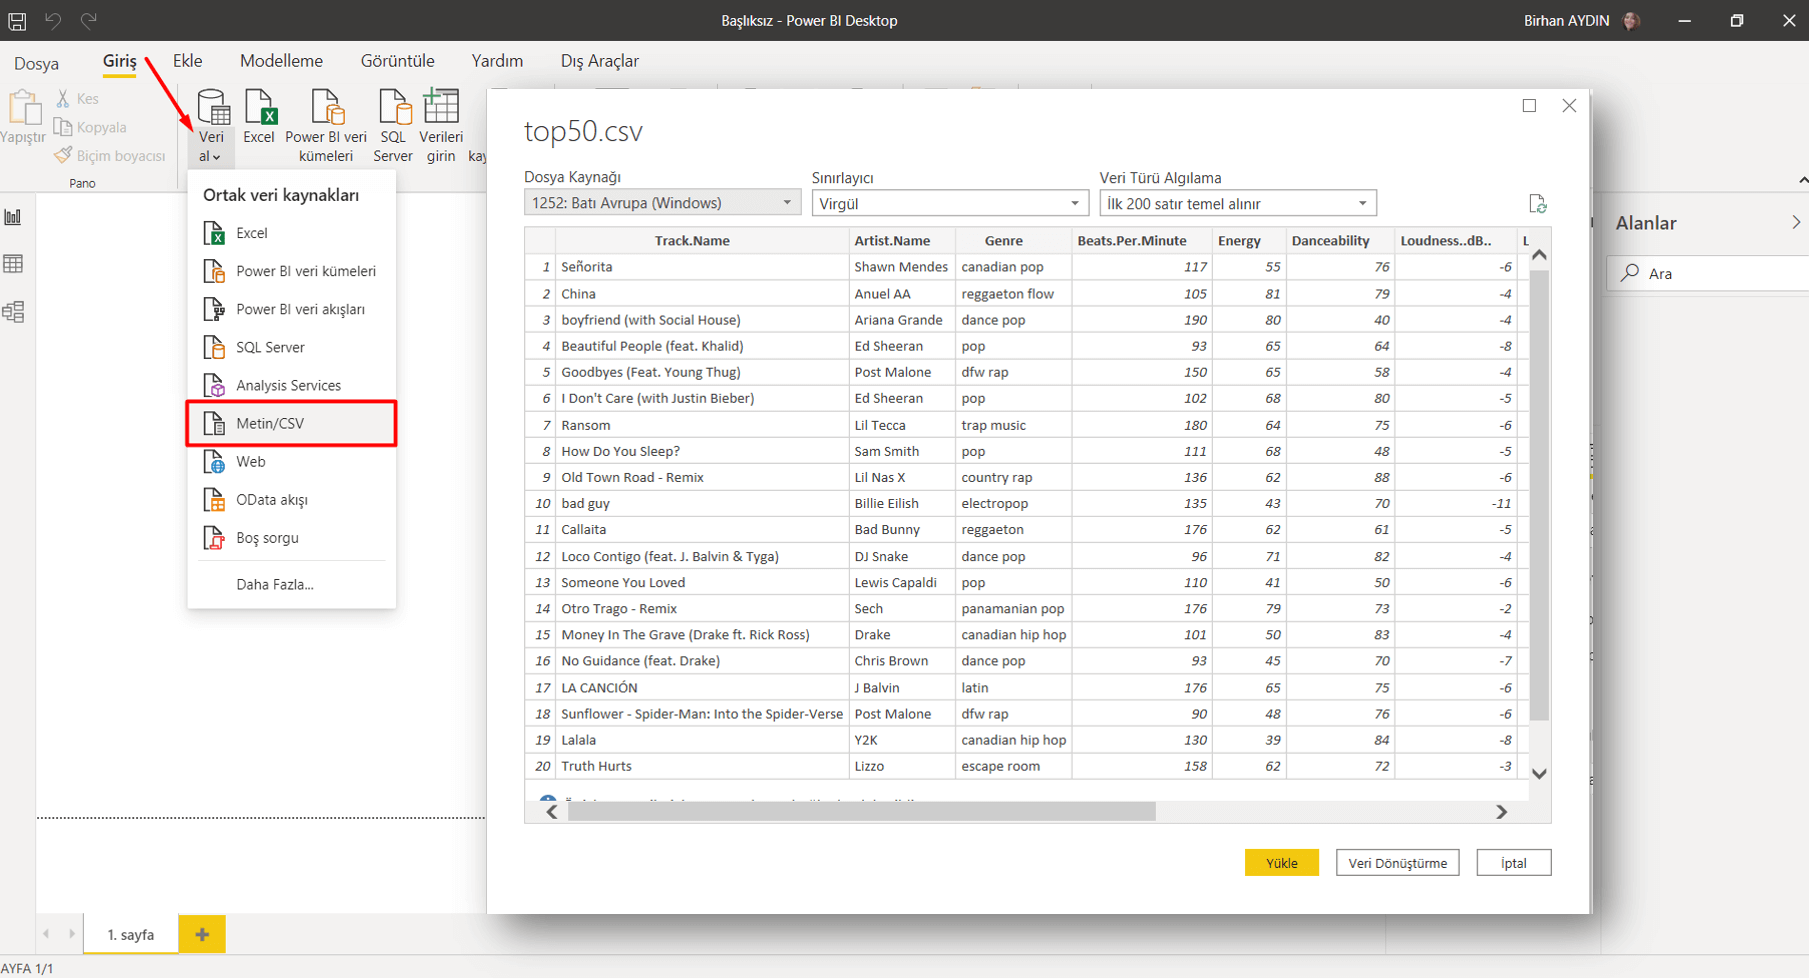
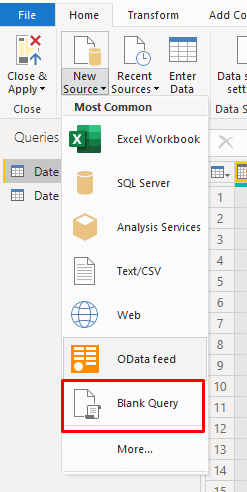
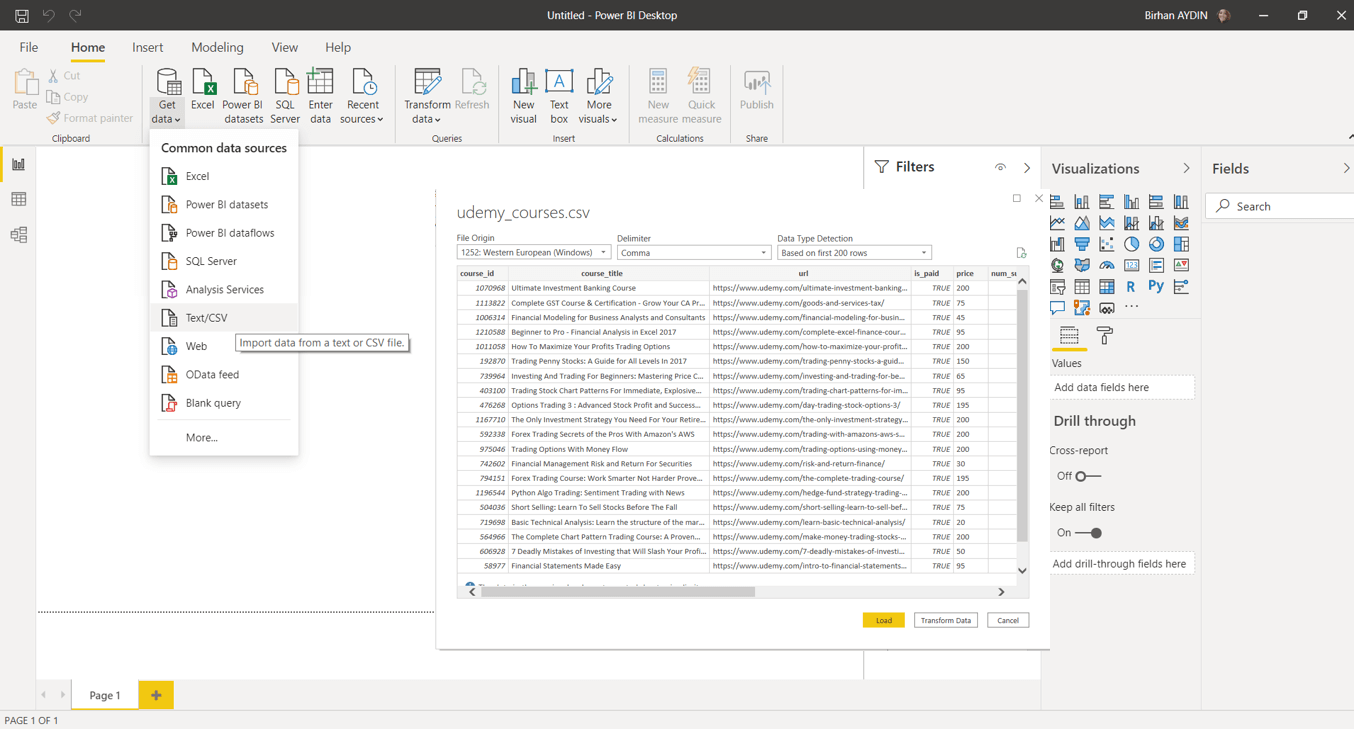
When you open BI Desktop you will see the title Get Data under the Home tab. It is attached right next to the most-used in that field. You might have noticed that you can also connect Excel directly. Here we click on Get Data and choose the Text/CSV title. Power BI asks you “Do you want you use this data directly or do you want to use it by making some changes?” every time you import data. I would like to say “I trust my data and choose to import it directly.” but I see that there is a bad data input on the ispaid column, for this I choose Transform. By the way as you can see it divided the .csv extension file itself by detecting the separators.
3- Edit the Data
We will be editing on the ispaid column in our data. The information on the column is given with the true/false expressions. We will be changing them as Paid&Unpaid and we will also filter a cell that has nothing to do with either of them.
Change the Data type
Data type is very important when it comes to data editing. The data type of the ispaid column that we will make changes on is Binary. To be able to change the expressions as Paid&Unpaid we will change its data type as Text. Power BI arranges the data type first every time it imports data and since we are making data type changes after this step it asks “Do you want us to save it as a new step?” At this point it doesn’t matter which one you choose, I requested it to add it as a new step.
Change the Values
Now let’s change the true expressions as Paid and false expressions as Unpaid on this column. We achieve this with the Replace Values command which is under the Transform tab. Here there is also a value that has nothing to do with the existing expressions and starts with “http..”. We filter this value and make it invisible on the front face.
This is all that we will be changing on this data. Finally, we close it by choosing Close&Apply. If you want to make a change on the data later you can access this display again with the Transform Data title in the Home tab.
4-Charts
Add the card that shows the number of courses
It is always nice to have cards that have information about the data on the corners. I actually want to get the information of how many courses there are in total. For this I will make the values on the Course_Id Column counted singularly. I hold this title and drag to the report area. It immediately creates a chart for me. I change it with the image of card and indicate that the values on the course_id column will do the enumeration. I transfer it to top right corner.
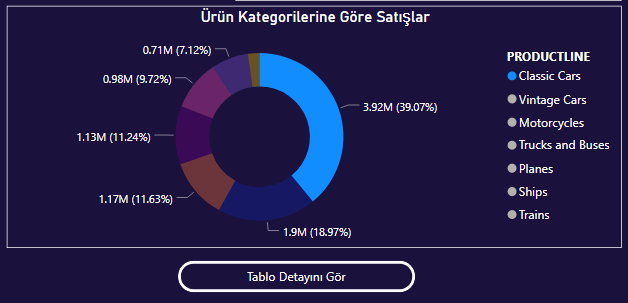
Add the charts that show the number of courses by prices and total hours
Now we are creating a chart for the second information that I am interested in. We take the price and course_id columns to the report area. We change the chart type as clustered bar chart. To see the number, we active the Data Label under the Format. We change the Display units as None. You can see that the numbers are very high in this stage. Just like in the card we change the action as Count for the Course_ID column.
We do an action similar to the one above for the hours as well. We change the Price as content_duration and add it to the report screen. We can copy the existing image for this.
Add the chart that shows the number of courses by subject and level
We take the subject and course_id columns to the report area. We change the type of the chart as clustered column chart. To show the number we activate Data Label under the Format. We change the Display units as none. In this stage too you will see that the numbers are very high. In order not to deal with the same situation with the other charts we click the course_id column on the column tab upwards and we choose Count(Distinct)[Count(Singularly)] on the Summarization area and we transform it to count the course_id column in our existing chart.
We take similar actions for levels as well. We change Subject as level and add it to the report area. For this too you can copy the existing image.
Add the chart that shows the number of courses by spreading throughout years
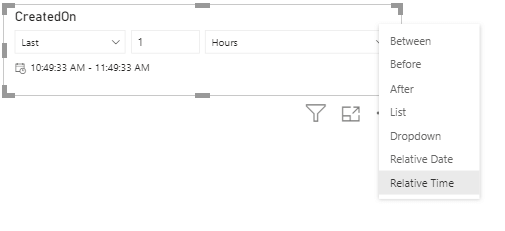
About the other chart that we are going to be adding… I saw a published_timestamp column and wanted to use it. Let’s see to which year the highest number of publications belong. For this published_timestamp and course_id take the stage. This time we will use the stacked area chart. After creating this chart, you will see that some of the years are visible, not all of them. This is because the dates generally continue non-stop. In order to fix this and see all years in the chart we go to the format tab and get to the details of the X-Axis title. Here we change Type as Categorical.
Add a Table
Is our screen getting more complex or what? Don’t worry in the end it will not seem complex at all! 😎But for now, we will increase the chaos and do another action by adding a table. Here I saw the web links of the courses and thought that it would be nice for it to go there by clicking the link from the table. If we are on the same page here, let’s go.
Let’s take the columns that will exist in our table: url, course_title, subject, published_timestamp, num_lectures, num_reviews, num_subscribes. The main concern here is to define a field as URL. By choosing the .url column we change the Data Category in the Column tab as Web URL and the url in the table changes into the blue and underlined writing that we are all used to. By making another change we will change it into a symbol. We achieve this by activating the URL Icon button in the Values field under the format of the table.
 Fundamentally we have added everything that we were going to. Now it is time to organize all this. For this you can follow two options. Since we don’t know the data here, we created charts to see what can come up. In another version if there are fields that come to your mind you can directly start with the visual arrangement.
5-Organize the Page
Spoilers
: From this point on people who enjoy messiness will be sad.
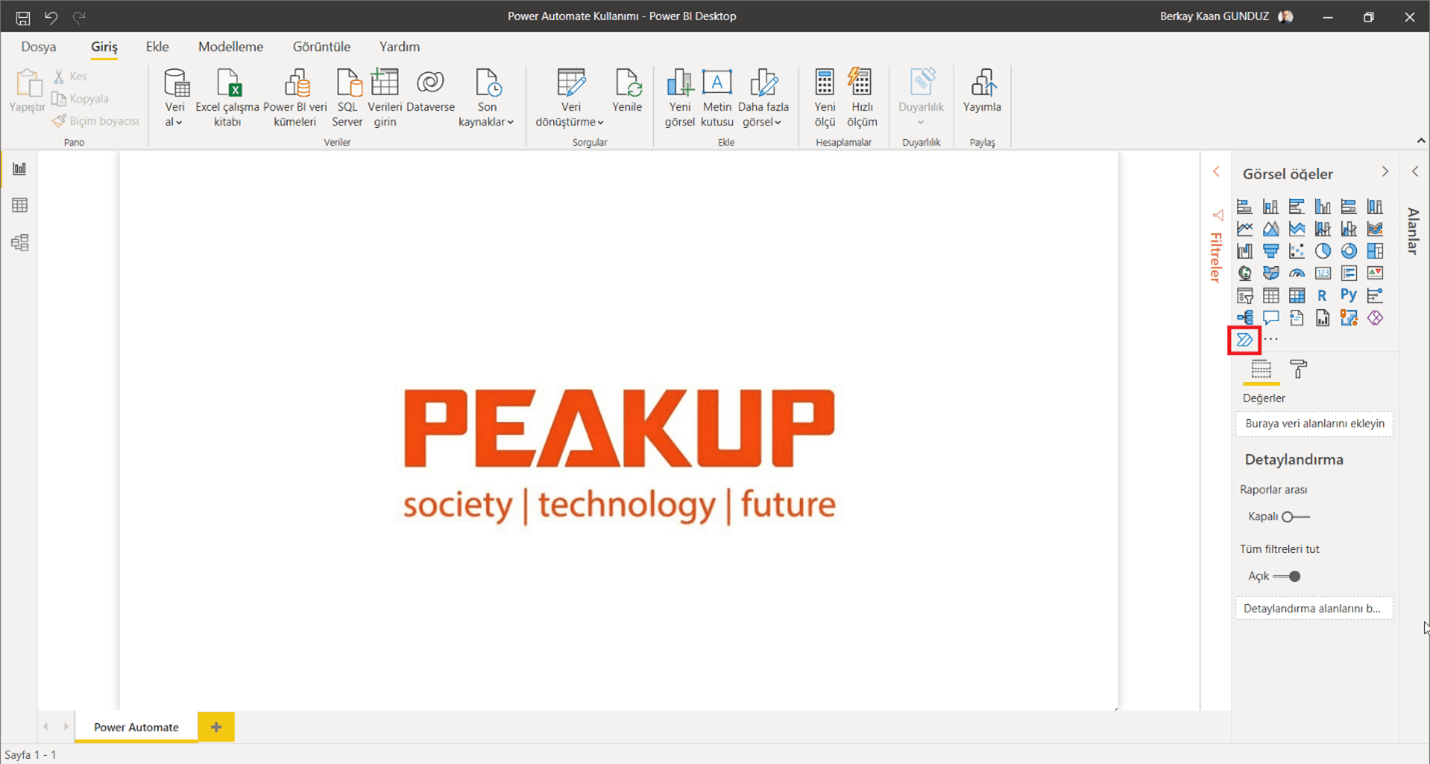
Logo is one of the main factors to make a report seem corporate. We download the logo of Udemy from the internet.
We import it in Power BI. We add the Udemy image by clicking on the Image option in the Insert tab. We usually put the logos on the top left corner, thus we can carry it there.
Then we change the background of the page. We will use the code of F6F6F6 for the page’s background. In order for more columns of the table to be visible I change the page size from 16:9 to custom and make the height value 920. Afterwards I choose the Temperature theme that would be closer to the color of Udemy. After the theme all the colors in my charts become dark blue. I don’t want all of them to be same color. For this reason, I change the colors of two of them. You can achieve multiple selection with CTRL.
Then I change the places of the charts. We arrange the width of our card. We will put two clustered bar charts to the left and right corners and put other charts in between them. We will choose for the grey background to be seen in between the charts and arrange the width and the distance accordingly. After placing the charts for a nicer look, we will use round edges. For this we activated the Border field in the Format tab, change the color to white and maximize the radius.
Lastly, we give the last form to our table. I chose to close the left gap by making the column titles and the values and the width of the columns bigger. You can also add a small chart to the gap.
Aaand we are done! With all these steps by holding and dragging we created a fast and a basic report with Power BI. I hope that we haven’t lost anyone on the way while the article was flowing and that you liked it. I wish the best of luck to people who want to work on this report and improve it further, I am sure that there will be amazing visuals! I leave here a fast beginner-level link for you to take a look at our other articles about Power BI. Take care!
Good game well played


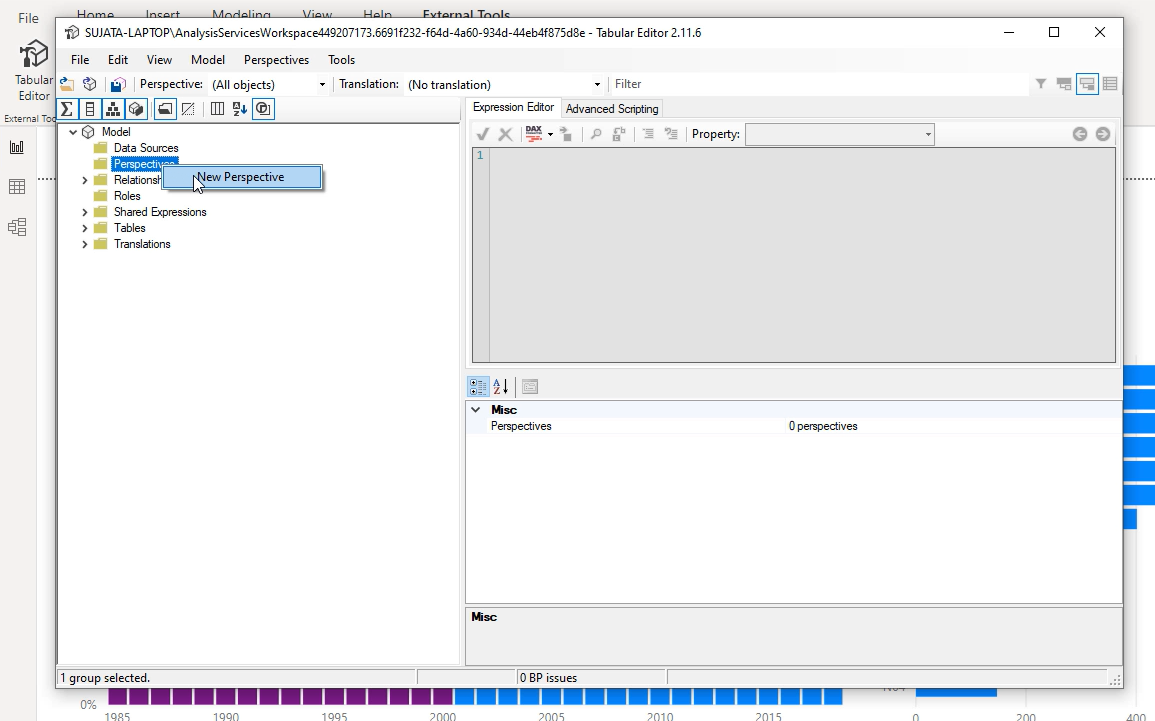
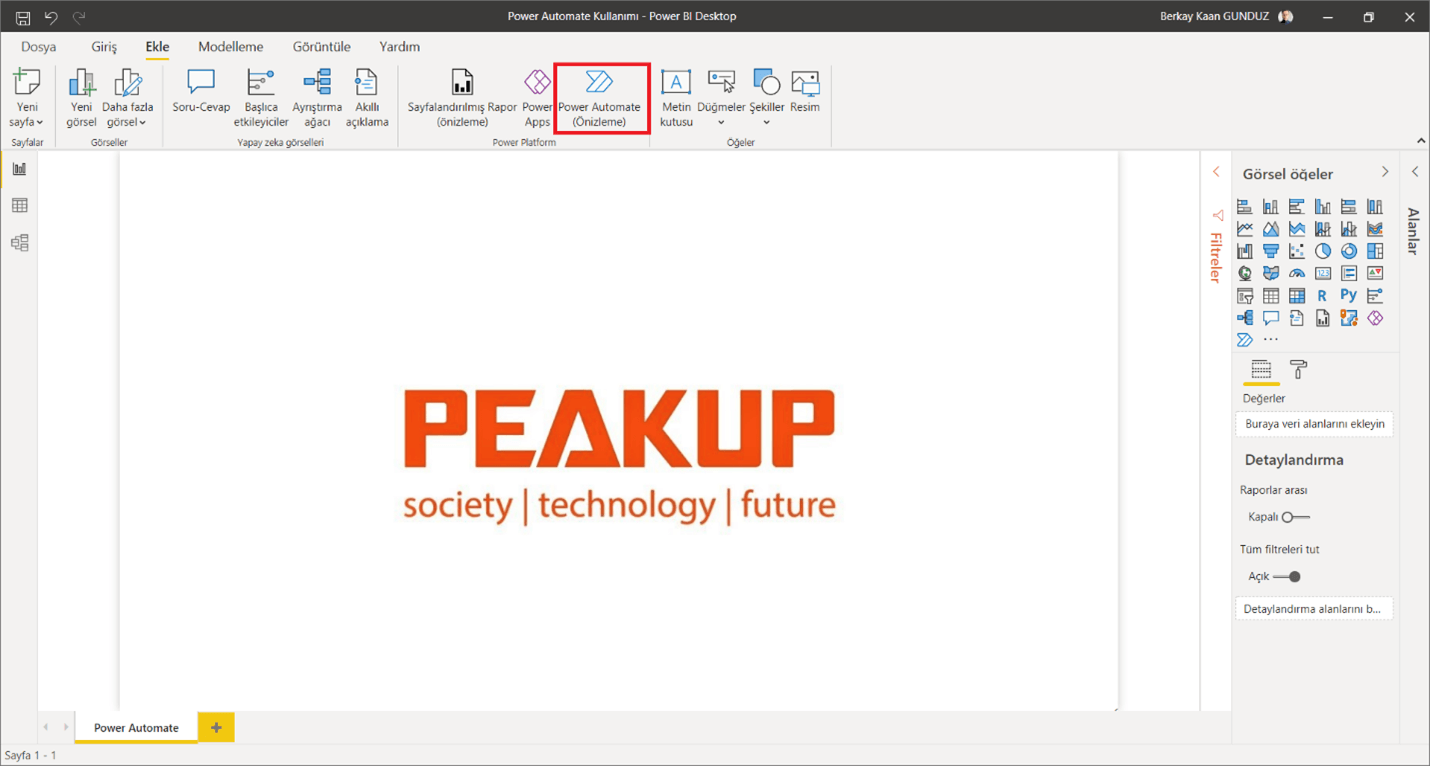
 The hard thing is here for the user to make the correct decision. For this, we will use on of the tools developed for Power BI: Tabular Editor. As well as you can use these tools directly, you can already add them under a tab on Power BI Desktop. You can check the 3rd title