COO KadirCan Toprakçı – Exclusive Video Interview

[mk_page_section][vc_column width=”1/6″][/vc_column][vc_column width=”2/3″][mk_fancy_title color=”#000000″ size=”20″ font_family=”none”]You can watch the video of Funda Güleç Yalçın’s interview with our COO KadirCan Toprakçı concerning the agenda, digital workplace notion and our solution Velocity that increases office efficiency. [/mk_fancy_title][vc_video link=”https://youtu.be/Zx404Ba3NnU”][/vc_column][vc_column width=”1/6″][/vc_column][/mk_page_section]

Things to Pay Attention to while Migrating a .NET Framework Project to .NET Core

At PEAKUP there is a new “Data” project that we have developed a long time ago in order to provide some data that our own products need from one center instead of keeping it app based. First of all, I want to talk about what the application does and what it contains. We started to develop the project with .NET Core when it first came out and then migrated to .Net Framework to wait a bit more till .NET Core becomes a bit more stable. The data base was designed completely with EntityFramework Code First. We use Azure SQL Server as database. This application alongside the geographical information like continent, country, city also has information that is needed in pretty much any application like 2020/2020 Public Holidays, current weather condition and exchange ratesThere are also 2 more Azure Job Projects that connects to more sources and registers data for weather forecast and exchange rates and registers them to both the database and Cache in order to give faster outputs with Redis alongside the web app that we use for the presentation of data in the server 

Why are We Migrating to .Net Core? 

 First of all, when we take a look at Microsoft’s development efforts for .Net Core and what is going on, it is not hard to foresee that in the long term the developments for .Net Framework will stop after some time of they will be restricted. It is obvious that some stuff I will talk about are possible with .Net Framework as well, but they are not as good as .Net Core for sure and that some problems come up and cause extra time-loss.

Seeing the libraries for features like Image Compression, Video Compression that we want to add to the Project soon are only developed by .Net Core is very important when it comes to cutting the effort for the long-term developments in half.

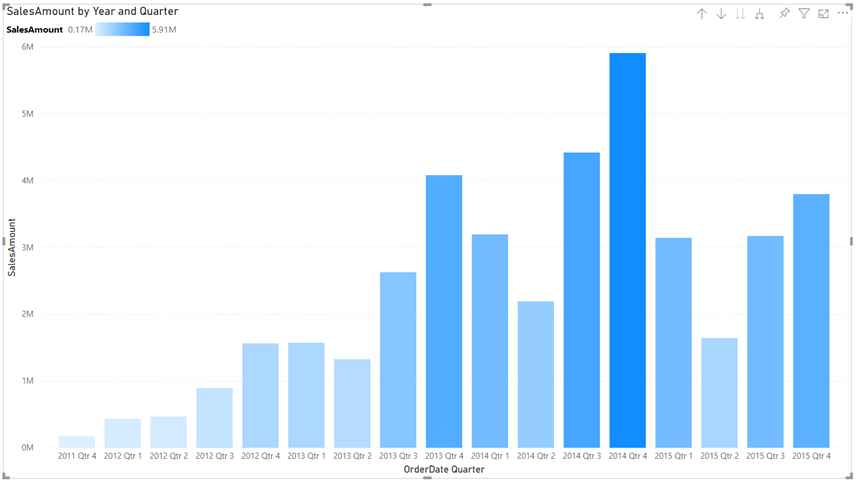
A big increase in the weather forecast and exchange rates data is observed while the number of users in other PEAKUP products who send request to the application increase. Taking precautions for the upcoming problems of the increase in Response time as the number of requests to the app and data size increase, and web app we use and SQL data base becoming a problem in terms of cost and performance are among the most important reasons.

For now we keep the project in two different Git Branches. We do the developments on Dev, after seeing that everything is okay we merge it to Master and run all the Deployment activities manually during this process. Even though it is not a project that we open and work on frequently, this process being out of manually deployed situation with Azure DevOps and the feature of automatically deploying and running Migrations on database on its own is a development we desire. Doing this more efficiently and faster with .NET Core is more flexible because package management in the project is designed in an easier way.

We used to switch between Azure Service Plans to scale unusual load the customers who changed to apps as SaaS by PEAKUP got when they completed the process once and announced the products to their users. This causes some restrictions on the side of  Azure Web Application in terms of costs and scaling the application.  The app moving to Containers completely thus Scaling Down itself and run limitless Containers and responding all the request with the same speed or even faster in case of need with Azure DevOps was one of the features we desired. After the tests I did after I migrated the project, I saw that it was too early for the steps concerning Docker and Kubernetes and decided to continue with the web application.

Problems I came across and their Solutions 

  • Change in Routing

I started to foresee how achy the migration is going to be when I came across this problem that I spent almost half a day on. There were two GET methods we used in the Interface design in the project and one of them routed all the records and the other routed the data as to Id parameter it got. I researched and found out that it is not allowed yet to prevent faulty designs concerning Routing on .Net Core. For this I decided to continue with a method that acts differently on each occasion by nulling the Id parameter in the method.

  • Different Names in Entity Framework Core 

I used all the models we used while developing the project while switching to .NET Core. I was sure that Schema that was going to be on database thanks to Auto Migration was going to be the same but I saw that while domain names where relationships are established on .NET Framework didn’t go through any changes between the areas used for relationships, on .NET Core underscore was added. For this to set up Schema as it is and to migrate the data on Production directly, I utilized the [ForeignKey(“X_Id”)]  attribution to make the data on the column suitable with the old standards.

  • Database Migration

I imported a copy of around 12GB data to a server on Azure without losing any data on the database. From there I took a data around 12GB that I zipped and downloaded to my computer to my device as a 900MB text and started to try scenarios concerning data migration. Weather, Forecast and Currency tables were the main reason of size being that big. For this I decided to move on by migrating these three tables one by one. I can say that between the scenarios I tried, I did benchmarking in SQL, so to speak.

Even though I ran the file I imported completely on a database and then provided data entry, these actions took too long and after a while if there was a mistake all the time I spent would turn to dust. Therefore I chose the Import Data option that came as default in SQL Management Studio to migrate each line one by one and to see the consistency between the Schemas on two different databases. In this step I saw that Entity Framework created the the data type difference of datetime on .NET Framework and datetime2 on .NET Core.

I went back to the project and added the [Column(TypeName = “datetime”)] attribute in the beginning of the Datetime fields and made sure that it stayed that way for the data migration on Schema and imported it successfully to my device in 15 minutes.

To run an EF Core database on Production I deployed both the data base and the application by opening the Web Application. I decided to go on with the Linux Web Application I used for .NET Core and then had some problems. I talked about them in the upcoming steps.

  • Library Change on the Cache Layer

We used to use the ServiceStack.Redis library that had a better performance and API design and that offered a cache memory solution with a higher performance with its specially developed JSON library. But since the Nuget library on which we did this development hasn’t been updated for a long time thus we stayed away from this benefit and we didn’t see its performance concerning Connection Pooling I changed to Stack.Exchange.Redis Library developed by StackOverFlow.

  • Critical Lacks in Text. Json

I can say that Microsoft has been obsessed with developing System.Text and all libraries under it for  performance and JSON actions of .NET Core for a long time. I have been following that there is an increase of performance in almost all Framework versions in a lot of projects that use System.Text Namespace when benchmarking tests are done. I thought and guessed that a library coming from Built would be better in JSON’s routing in API to get rid of Newon.Json’s and ServiceStack.Redis’ JSON library  data reading-writing to Cache. But than a huge disappointment waved at me! Cause I saw in the Microsoft Document published about migrating from Newton.Json that many features like PreserveReferencesHandling, ReferenceLoopHandling haven’t been developed.

  • Features in Linux Web Application that haven’t been completed on Azure

First I ran the application in a standard way that I can manually test and then run performance test without waiting for a Pipeline and to continue after Staging. I started the action by publishing and came across a 1-hour disruption on Azure by chance and thought that there was something wrong with the application. After losing two hours I found out that there was an incident on Microsoft and some issue might occur on the European continent that we work on. At that point I started to work on the next steps on the application. And I realized that the disruption was a blessing!

Some of the data we import concerning exchange rates and forecast flow instantly and some of them flow hourly. We dealt with them without leaving the job as Azure Job before anyways. I couldn’t find the Web Job tab inside the Web Application to observe some problems about it staying the same way and what will happen! First I thought it might have to do with the Tier of the application so I moved to an upper Tier and Web Job didn’t come back.  Then when I did some research I found out that Linux type Azure Web Applications lacked a lot of things. Without waiting for the disruption to be over I deleted the application and continued by opening a new Windows type web application.

The reason I made that decision had to do with the structure continuing through Kubernetes and Container depending on the success of Load tests.

  • Load Testing  

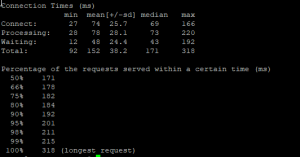
There is a paid and an unpaid tool developed by the engineering team of SendLoop know by everyone as an e-mail marketing company. I always wait for the first test to go through here with this tool that you can reach on https://loader.io/ and then do the load tests with EU project of Apache. The first test with this tool that goes up to 10.000 requests was pretty successful. A serious decrease was seen in response time but after a while the application would start to slow down.

I realized that there was an unreasonable expansion in Memory in Web Application and that after a point there was no space even a space of 1 MB. When I analyzed the requests I saw that the method I used was going on with AddAndWrite scenario instead of OverWrite on the given Key of data! I solved this problem right away and continued the tests after upgrading the packages.

After I saw that requests passed successfully on SendGrid I started to do tests with the EU Tool. For this I used a server that had a very good internet connection. Now everything is ready and I can move on to the last step on DevOps.

  • Changes in DevOps Pipeline Setup 

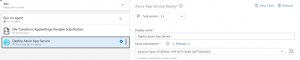
After I turned the project into a condition that received requests, I started to separate it into three Stages: Production that I talked about in the beginning of the article, Beta that works with a live environment and code development and DEV. First I completed the migration in a way that Master, i.e. Production would follow the sequence.

And I came across an interface change Azure did on DevOps Pipeline. I found out that the infrastructure of the library i.e. changes done concerning ConnectionString, special keys etc. are added as a Step while  migrating Artifact output to the Release step with a Versioning system now.

Sputnik Radio “Corona Diaries”

[mk_page_section][vc_column width=”1/6″][/vc_column][vc_column width=”2/3″][mk_fancy_title color=”#000000″ size=”20″ font_family=”none”]Our COO KadirCan Toprakçı appeared as a guest on the “Corona Diaries” program presented by Serhat Aydın on Sputnik Radio. In this broadcast that we talked about our Digital workplace platform Velocity, we mentioned our global success and solutions that we offer.[/mk_fancy_title][mk_audio mp3_file=”https://peakup.org/wp-content/uploads/2023/12/sputnikradyovelocity_kt_15052020.mp3″ player_background=”#ea8435″][/vc_column][vc_column width=”1/6″][/vc_column][/mk_page_section]

We Welcomed the Webrazzi Team at our Office

[mk_page_section][vc_column width=”1/6″][/vc_column][vc_column width=”2/3″][mk_fancy_title color=”#000000″ size=”20″ font_family=”none”]We welcomed the Webrazzi team that visits important enterprises and technology centers in Turkey for the second time, this time at our new office. You can watch the program that we recorded in February. [/mk_fancy_title][vc_video link=”https://youtu.be/ZUhDVPt5BJk”][/vc_column][vc_column width=”1/6″][/vc_column][/mk_page_section][vc_row][vc_column][/vc_column][/vc_row]

Teams and Cloud Storage – A Deep Insight

[vc_row][vc_column][mk_fancy_title size=”20″ font_family=”none”]In the last week of our event we went to the beginning and thought about what more we can do on Teams while working from home and talked about the new features, Pop-out Chat being in the first place. Easy but important features like how we can filter our unread messages and notifications, how we can arrange our left navigation panel were among our event subjects. We also talked about the differences between opening Office apps on Teams/Online and opening it on desktop. We took a look at options like pinning for rapid accesspinning as a tab, installing the files we choose on the Files

We analyzed the notification settings on Teams Mobile app and talked about “receive mobile notification when Desktop app is not active” and pinning Chat/Channels to the frequently used. In the second part of our event we went into more details about accessing Version History. We talked about the storage space and technical differences between Chat and Channels. Saving an online only file from 1st and 2nd phase trash bins in what time and how when we delete it was one of our important topics.


Also, how to share a file without sending to Teams, having the files as only accessible when they are shared, limiting authority to edit and download were features that enable us to work in a safer environment. While we analyzed sending the files added to SharePoint Online to approval with “Request Sign-off” which was the last subject of our event, we showed how to access PowerAutomate templates in SharePoint [/mk_fancy_title][vc_video link=”https://youtu.be/hHUyTt-5zCo”][/vc_column][/vc_row]

The Most Basic DAX Functions of Power BI

Hello dear reader! In this article we will be talking about the most basic DAX functions of Power BI. We use these functions a lot in our daily lives. And this shows us that we will be using these while preparing reports.


Keep calm and think simple 😃 Yeap, the functions I will talk about go like this:

  • Count (COUNT)
  • Sum (SUM)
  • Calculate the average (AVERAGE)
  • Find the maximum value (MAX)
  • Find the minimum value (MIN)


All these functions have a very simple structure. We usually use the functions above in measures. The results of measures give a a single scalar value. We are looking for the answers of questions below as a single scalar value.

I got the exemplary data set for application of these functions from kaggle.com. You can reach example datasets here. This data set contains information about video games like name, rank, platform, year, genre, publisher, global sales . We will be getting answers of some questions we ask to the data set with the functions above.

Let’s transfer this data set to Power BI first. For this choose Text/CSV from Get Data options on the Home tab and lead to this data set. When you click OK to get this .csv format file it will recognize the bracket between texts and display the version automatically divided into columns on the Navigation window and we will only need to click Load.

In this stage we will try to get the answer of the questions below from this data set.

1-How many games are there?

Lets’s satisfy our curiosity about this first. We will count how many games there are by using the COUNT function from the basic DAX functions. We can use any column for this action. We usually choose the columns that we know will never be empty for counting. We write the related table and column name inside the COUNT function and execute this action. You can find the related syntax below:

Game Count= COUNT(vgsales[Name])

By typing this function we find out that we are talking about 16.598 games here.

2-What is the sum of values on the Global_sales column?

When we talk about sum of values on a column another basic DAX function comes into play. We will obtain the sum of values on the GlobalSales column by using the SUM function. We have to choose a column with numeric values to use the function. The column we want the sum of contains numeric value of Decimal Number data type. We do the action by writing the related table and column name into the SUM function. You can find the related syntax below:

GlobalSales Sum= SUM(vgsales[Global_Sales])

We obtain the sum of values on the GlobalSales column as 8920.44 with this function.

3- What is the average of values on the Global_Sales column?

Let’s find the average for the same column. If we are talking about the average of values on a column, the function we will use is AVERAGE. To use AVERAGE function as well we have to choose a column that contains numeric data type just like in the SUM function. We can obtain the result we want by writing table and column name in AVERAGE function just like the two functions above. You can find the related syntax below:

GlobalSales Average= AVERAGE(vgsales[Global_Sales])

AVERAGE function gives as the answer as the value of 0.54. The average sale price of the games in this data set is 0.54.

4-What is the maximum of the values on the NA_Sales column?

This time we have another curiosity on another column. What is the maximum sales value on the NA_Sales column? The answer of this question can be provided by the MAX function only. Of course for this function too the related column has to contain numeric value. But this function gives us two syntax options: we can find the maximum value in a column, or can tell which one is bigger of two scalar values. We will request the maximum value in the whole column. The general use of MAX function is like that. You can find the related syntax below:

Maximum NA_Sales = MAX(vgsales[NA_Sales])

According to the information we obtained with this function, the maximum value on the NA_Sales column is 41.49.

5-What is the minimum of the values on the NA_Sales Column?

This is the last question we will be asking: What is the minimum sales value on the NA_Sales column? We will use the MIN function to get the answer of this question. While it has been built to bring out the minimum value, the syntax is completely same with the MAX function. The general use is to find the minimum value on a column. You can find the related syntax below:

Minimum NA_Sales = MIN(vgsales[NA_Sales])

According to the information we obtained with this function the minimum value on the NA_Sales column is 0.

With this last question we answered all the questions above by using the most basic DAX functions.


DAX fonksiyon sonuçları

If you please, you can download the .pbix file in which all these actions are done here. Until next time, bye!

Good game well played.

Power BI – 2020 July Favoruites

Hello dear reader! This month’s updates are for those who can resist the charm of sea and sand right in the middle of summer. There are two very important features among Power BI July 2020 updates. Let’s go and take a better look right away.

1-   The most important update: Financial Functions on Excel are now on Power BI!

A total number of 49 financial functions are coming to the infrastructure of Power BI. Since we build financial reports on Power BI, it is especially nice to have these functions. These functions added to Power BI have the same function same and syntax as in Excel. You can reach functions and their details here. You can find the names of new functions below.

FINANCIAL FUNCTIONS
ACCRINT CUMIPMT INTRATE PDURATION SLN
ACCRINTM CUMPRINC IPMT PMT SYD
AMORDEGRC DB ISPMT PPMT TBILLEQ
AMORLINC DDB MDURATION PRICE TBILLPRICE
COUPDAYBS DISC NOMINAL PRICEDISC TBILLYIELD
COUPDAYS DOLLARDE NPER PRICEMAT VDB
COUPDAYSNC DOLLARFR ODDFPRICE PV YIELD
COUPNCD DURATION ODDFYIELD RATE YIELDDISC
COUPNUM EFFECT ODDLPRICE RECEIVED YIELDMAT
COUPPCD FV ODDLYIELD RRI

2-Notable Update: Azure Maps visual

Another update we see as important is Azure Maps being included among the defaults images of Power BI.  But, why is it so important? This chart has different  features than the other map charts.

Now we can add extra layers to maps. One of them is “Reference Layer”. With this feature a GeoJSON file containing custom location data can be uploaded and overlaid on the map. This way you can use it as a reference layer containing different information like population and real estate.

Another one is “Custom Tile Layer”. Tile layers allow you to superimpose images on top of Azure Maps base map tiles. What tiles? For example, weather forecast.

Another standing-out thing is that you can see the real-time traffic overlay on the map in your report. If you work in a logistic related area, it will be very useful for you in terms of increasing efficiency.

In order to activate this update, you need to activate Azure Map Visual in Preview Features. Then, when you restart Power BI, you will see it among default images on the right .


3-Update: External Tools ribbon- Preview

External tools are non-Microsoft tools that work with Power BI and that allow you to create calculations and calculation groups and analyze data in terms of performance. The prominent ones are:

  • DAX Studio
  • Tabular Editor
  • ALM Toolkit

These feature cannot be opened on Preview Features. We need to create a folder and set up these programs in that file. The folder shortcut should be:

Program Files (x86)Common FilesMicrosoft SharedPower BI DesktopExternal Tools

You can get details about downloading these tools here.

4- Gradient Legend

You can now see the color scale that have been conditionally formatted by columns and bar charts as a legend. Of course, unless you add a legend on purpose.

5-Global option to disable automatic type detection

Power Query tries to automatically detect column headers and types based on the data. This feature didn’t function on schema-less data sources and we had to fix it manually. Now we can disable automatic type detection against schema-less sources. This new option can be found under the Options dialog under Global > Data Load.

We cannot talk about data sources in Power BI 2020 July updates 😮 We haven’t come across this situation for a while. If you want to see prior Power BI updates or take a look at other Power BI articles on our blog, click here. Till the next time, take care!

Good game well played

How Do You Turn an E-Mail Signature into a Marketing Tool?

[vc_row][vc_column][mk_fancy_title size=”20″ font_family=”none”]As the communication processes are digitalizing, e-mail signatures are becoming an important marketing tool for every sector. Digitalization of communication also plays an important role in the determination of the target audience. Bearing in mind that a worker sends an average of 121 e-mails every day and the average number of this is 293,6 billion globally, why would you wait more to use e-mail signatures correctly? [/mk_fancy_title][mk_padding_divider][mk_image src=”https://peakup.org/wp-content/uploads/2023/12/signandgo-1.gif” image_size=”full” align=”center”][mk_padding_divider][mk_fancy_title size=”20″ font_family=”none”]

Create your Marketing Strategy with your E-Mail Signatures! 

You can create a pretty  effective marketing strategy by including your workers to the marketing process in the equation where when your visibility increases so does your brand’s recognition. You wonder how? 

You can make sure to reach the correct target audience the fastest and cheapest way the moment you add your announcements, campaigns and advertisements to your e-mail banners in a system that you can manage all your signatures centrally.  [/mk_fancy_title][mk_padding_divider][mk_image src=”https://peakup.org/wp-content/uploads/2023/12/signandgo-2.gif” image_size=”full” align=”center”][mk_padding_divider][mk_fancy_title size=”20″ font_family=”none”]

Numbers don’t lie!  

According to the studies every day the average worker sends 121 e-mails in average. Considering that the number of sent e-mails in a company with 100 workers is 12.100 making sure that your messages reach to thousands of people makes you obtain incredible results.  

What you have to do to use such a fast and easy communication tool is pretty simple.  [/mk_fancy_title][mk_padding_divider][mk_image src=”https://peakup.org/wp-content/uploads/2023/12/signandgo-3.gif” image_size=”full” align=”center”][mk_padding_divider][mk_fancy_title size=”20″ font_family=”none”]

Design Your E-Mail Signatures without Waiting for your IT Department 

Being able to access your e-mail signatures anywhere and anytime is the most basic matter when it comes to announcing your new advertising campaign without wasting time. Keep the control of the signatures that you can easily manage and update centrally. A consistent and well-designed signature banner increases your brand identity and reputation. You can create your own designs and advertisements easily without needing the IT department. Wouldn’t you like to design your own signature right now?  [/mk_fancy_title][mk_button dimension=”savvy” url=”http://freemailsignature.com/” align=”center”]Design Your Signature[/mk_button][mk_padding_divider][mk_fancy_title size=”20″ font_family=”none”]

Time to Say Goodbye to Business Cards 

We have a culture of loving traditionalism and not being able to detach from it. There are a lot of people who especially like to buy and even collect business cardsBut in these times where lately the contact decreased, the meetings are done online, and the companies change to digital management the life of business cards comes to an end.  

You can use the announcements and campaigns that you have on your e-mail signatures that you always keep updated as your business card and also reach them to hundreds of your associates, clients and end users. This would be an excellent communication channel that is more interactive compared to handing out your business cards one by one and that you can get the feedback immediately from.  [/mk_fancy_title][mk_padding_divider][mk_image src=”https://peakup.org/wp-content/uploads/2023/12/signandgo-4.gif” image_size=”full” align=”center”][mk_padding_divider][mk_fancy_title size=”20″ font_family=”none”]

Locate your Banners Correctly 

You can send the messages that you have highlighted the content of, advertisedand that you want to convey with the designs that reflects your corporation to your potential clients instantly.  

 Having more fame and sticking-in-mind better is as close to you as a signature. 

Your e-mail signatures that you have created with a short and effective message will increase the click rate as well. And this will provide you competitive advantageThe simpler and more comprehensible for your target audience the message content, design and content language is, the more impact you will have on the receiver 

Imagine creating different advertisements for each one of your advertising campaigns and activities and having to updating them all the time. This process will be a burden for you in terms of both time and costs. The effects might ware off as you plan the right campaign and you might not be able to get the desired reaction right away. You can design your e-mail signatures for the campaign and the target audience you desire on a department, sector or person base. Thus, the messages you send will be more personalized. Making a good impression on the e-mail receiver will be very important in terms of your persuasiveness. 

You can liven up your mails with the signatures you can effortlessly design on Sign&GO and reach your brand recognition to the target audience you desire with a right strategy.  

[/mk_fancy_title][mk_button dimension=”savvy” url=”https://peakup.org/global/signgo/” align=”center”]Try Sign&GO![/mk_button][/vc_column][/vc_row]

Games as the Language of Children

[vc_row][vc_column][mk_fancy_title size=”20″ font_family=”none”] The importance of games has an irreplaceable place in children’s development in terms of language development, physical and intellectual development and self-care development. Games help children to develop by bringing out their skills like exploration, imitation, and creativity. Games are an opportunity to solve problems.

Even though as parents we doubt the security of technology and feel worried about it, playing games also reflect as learning on our children.

Our children who were born in to a time of digitalization and see tools like phones, tablets, computers and imitate what they see with their imitation skills get involved in this situation -even though we are careful about it and draw the line- somehow. We complied a few applications that can be beneficial as long as parents are in control and that our children can learn as they play.

ABC WOW:

It is an interactive application that helps children to learn the alphabet and English words with objects and the sounds they make when you touch them,  and that helps to develop their visual and auditory memory. The sounds of the objects make children laugh and entertain them. It is a verbal-auditory app i.e an app that is based on language. Although legal age-limit of the app is 4+ you can use it with your babies over 1 under parental control.

[/mk_fancy_title][mk_image src=”https://peakup.org/wp-content/uploads/2023/12/abc.png” image_size=”full” align=”center”][mk_fancy_title size=”20″ font_family=”none”]

WWF Together:

This application narrates the interactive story of endangered animals like giant pandas, tigers, monarch butterflies, sea turtles and polar bears thoroughly.It is a learning-centered game that enables getting to know 16 species of endangered animals with information like their features, populations natural habitats, weights and heights. There are also graphics in which origami art was used. There are “origami methods” where they can create these animals with paper within the app. You can execute this paper folding art with your children while having fun. Although legal age-limit of the app is 4+ you can use it with your babies over 1 under parental control.

[/mk_fancy_title][mk_image src=”https://peakup.org/wp-content/uploads/2023/12/wwf.png” image_size=”full” align=”center”][mk_fancy_title size=”20″ font_family=”none”]

Listen & Understand: 

This app was developed with the goal of contributing to development of comprehension what is being said of children with normal development, along with children who has autism spectrum disorder.

The app consists of 2 parts and 10 modules in total. In each one of the 10 modules there are 10 questions. Another important feature of the application is that it collects and analyzes data for the family and educators. It is a learning-based and a dramatic game as an education method. Although legal age-limit of the app is 4+ you can use it with your babies over 1 under parental control.[/mk_fancy_title][mk_image src=”https://peakup.org/wp-content/uploads/2023/12/dinle-anla.png” image_size=”full” align=”center”][mk_fancy_title size=”20″ font_family=”none”]

Paintbox :

Children’s senses work really well during the game. They develop their skills like perceiving, distinguishing and classifying the data they obtain by their senses in their brains. It is an app designed to improve children’s drawing skills by using colors with graphic and drawings activities on a digital environment. There are 8 types of different brushes and you can automatically save the images. Although legal age-limit of the app is 4+ you can use it with your babies over 1 under parental control. [/mk_fancy_title][mk_image src=”https://peakup.org/wp-content/uploads/2023/12/paintbox.png” image_size=”full” align=”center”][mk_fancy_title size=”20″ font_family=”none”]

Stack the Countries:

Provides 193 country flash cards and colored interactive maps of continents. It is an educational app where children can improve their geography and atlas information. It is one of the learning-focused interactive apps where they can get information about capitals, borderlands, flags of countries and continents. The parents can brush up on their information as well and spend some time with their children. Although legal age-limit of the app is 4+ you can use it with your babies over 1 under parental control.

[/mk_fancy_title][mk_image src=”https://peakup.org/wp-content/uploads/2023/12/stack.png” image_size=”full” align=”center”][mk_fancy_title size=”20″ font_family=”none”]

Nasa Kids Club

We couldn’t forget about science and technology enthusiasts! Along with the activities on the web page where children can learn a lot about NASA and play games about the space, there are coloring activities for younger space enthusiasts. You can visit their website. With the NASA mobile app we can recommend for adults, you can explore the latest images, videos, task information, news, feature stories, tweets and NASA TV features. Although legal age-limit of the app is 4+ you can use it with your babies over 1 under parental control.  [/mk_fancy_title][mk_image src=”https://peakup.org/wp-content/uploads/2023/12/nasa.png” image_size=”full” align=”center”][/vc_column][/vc_row]

Safe Collaboration with Office Applications and OneDrive

[vc_row][vc_column][mk_fancy_title size=”20″ font_family=”none”]In the 2nd week of our event we talked about some actions we can take in order to prevent data loss in some issues about our computer while working from home. For example, we showed that it is possible to access that data on our phone or another device by keeping a backup of our desktop and other files on OneDrive. We took a deeper look at the simultaneously working on a shared document feature: Writing comments while editing these documents, tracking changes in the documents with the “Track Changes” feature and even accessing old version makes accessing without losing the copies of each document easier. This week we also made our work sustainable with being able to scan our documents by bringing the scanner option at our offices home, saving these documents as PDF and even signing them within the new mobile Office application. [/mk_fancy_title][vc_video link=”https://youtu.be/g91WtBvIDnw”][/vc_column][/vc_row]