Power BI DAX Functions: the FILTER function

Hello dear reader! In this article we will be analyzing a Power BI DAX Function, the FILTER function. It is one of the most frequently used ones. In our previous articles we talked about most frequently used basic functions like this one. You can read the details here.

Let’s talk about the data set we will be using first. The data set that we will import from kaggle.com again contains top 50 songs on Spotify and their details. You can download it here.

The FILTER function allows us to create datasets filtered by the criteria we desire. It gives a table as a result of the function. Therefore it is among the table functions. If we are going to use the FILTER function only, if we are not going to use it in any other function, we have to use it with the New Table command. The syntax of the FILTER function goes like that:

=FILTER( , )

Both of these parameters have to be written, or the function will fail. If we are to explain the filtering a bit more, we can put it like this: True or false statements should be obtained as a result by using mathematical signs like <“, “>”, “=”, “<>”. You can use logical operators (And & Or) for more a complex filtering.

Let’s start with transferring this data set to Power BI. For this we will go Home > Get Data > Text/CSV.  To get the .csv file you click OK and it will recognize the separator between texts and show the version divided into columns in the Navigation window. We go Load here and make it load to Power BI.

We will create 2 new tables with the FILTER function in this data set. For this we click on the New Table command under the Modelling tab.

1-Filtering by Numbers

Out first table is going to be of those songs we just want to dance to! The column that will enable us to run this query is the Dancebility column. We will list the values over 80 on this column. To write this filtering statement we will be using the “>” mathematical operator. Since we will be filtering rows on a column, it is going to be enough for us to write the name of that column. The syntax we will write goes like this:

Dance over 80 = FILTER(top50, top50[Danceability]>80)

2-Filtering by Text

Our second table is going to be listing the Pop songs. For this we will be using the Genre column.

Pop_Songs = FILTER(top50,top50[Genre]="pop")

So we filtered by both text and number. If you paid attention, we didn’t put the numbers in double-quote. Double-quote is used for texts only. And never forget that:

Two single quotes don’t make a double-quote!

I mean apostrophe by single quote. Sometimes some people try to do the action by using two apostrophes. Since this statements has a different meaning in computer language, even though it looks write you will face an error as the result of the function. So I recommend you to always be careful about this.

We came to the part where we move the new tables we obtained from these actions to the report. I moved the columns we filtered first, and then put the non-filtered array to the left. You can get the file here if you want.

spotify top 50 report

We analyzed the the Filter Function which is a Power BI DAX Function. We will keep analyzing other functions, various issues, dead-ends, and possibilities in other articles. Take care!

Good game well played.

13 Golden Rules with the Intranet Portal Velocity!

[vc_row][vc_column][mk_fancy_title size=”20″ font_family=”none”]One of the obligations that Covid-19 pandemic has brought along is remote working and adapting to this process. Many companies remained distant from the notions of digitalization, being a digital workplace and thus they were caught off their guard by this sudden change. The first step of being a digital work place to adapt to this process easily and fast goes through intranet platforms.

We will be talking about 13 steps to take with an intranet platform in order to work faster and more efficiently, motive your workers , and overcome  obstacles of remote working .[/mk_fancy_title][mk_image src=”https://peakup.org/wp-content/uploads/2023/12/gif_start.gif” image_size=”full” align=”center”][mk_fancy_title size=”20″ font_family=”none”]

1- Make your workers gain more digital experience! 

You can start with intranet platforms to adapt your workers to digitization and gain their trust as a beginning. You can break their negative perspective to digitalization by making the adaptation process fun and fast. By this means, workers who experience digital platform can get rid of their biases against digitalization. [/mk_fancy_title][mk_image src=”https://peakup.org/wp-content/uploads/2023/12/gif_1.gif” image_size=”full” align=”center”][mk_fancy_title size=”20″ font_family=”none”]

2- Don’t let remote working intimidate you 

While remote working was seen as a luxury before, it has become an obligation with the situation we are in. Students going through extraordinary situations like quarantine, and  workers who have been away from their social environment can face problems like depression and lack of motivation. One of the easiest way to prevent this is to bring your communication under a single roof with digital platforms. You can keep continuity of your communication by utilizing digital tools with your workers. This way you can eliminate the fear of work or education going wrong while remote working. Remote working fast and efficiently with correct strategies is as possible as working at the office.[/mk_fancy_title][mk_image src=”https://peakup.org/wp-content/uploads/2023/12/gif_2.gif” image_size=”full” align=”center”][mk_fancy_title size=”20″ font_family=”none”]

3- Centralize Communication 

We have to prevent communication gap during the remote working and distance learning processes. Considering negative scenarios that might happen, there is a need for central communication channel with announcements, event calendar etc. where everyone can get informed fast at the same time. People who communicate centrally keep up with recent news and things that should be followed even while remote working.[/mk_fancy_title][mk_image src=”https://peakup.org/wp-content/uploads/2023/12/gif_center.gif” image_size=”full” align=”center”][mk_fancy_title size=”20″ font_family=”none”]

4- Extend Your Corporate Culture

It is not easy to make employers accept or even love the corporate culture. Intranet portals play a helpful role at this point. Gamified work processes, fun activities, facilitated work tracking processes help to balance the workload of workers. By tracking their work well; they access the file, document or image they are looking for fast and save time. This way with happier employees and more organized work processes, you infuse your corporate culture. [/mk_fancy_title][mk_image src=”https://peakup.org/wp-content/uploads/2023/12/gif_4.gif” image_size=”full” align=”center”][mk_fancy_title size=”20″ font_family=”none”]

5- Follow HR announcements through one single portal

One of the factors that makes HR departments happy is, without any doubt, intranet portals. Because there are a lot of topics like reaching out to each worker one by one, informing and expressing subjects like Law of Protection of Personal Data. And not to mention that there are a lot of questions to be answered… Thanks to the intranet platforms, HR can share all the legal, social and corporate processes with everyone through application cards. They can follow problems, motivation and issue of each worker easily by means of an organized and easily followed area. [/mk_fancy_title][mk_image src=”https://peakup.org/wp-content/uploads/2023/12/gif_5.gif” image_size=”full” align=”center”][mk_fancy_title size=”20″ font_family=”none”]

6-Walk away from the intranet problems created with old infrastructures

A lot of companies are biased about intranet platforms because of features that need to be updated all the time, always paying extra fees because of user limit, needing consultancy and slow opening pages. They don’t want to be involved in processes that cause a lot of work and need follow-up all the time. At this point, you can get a ever-updated and fast intranet portal that has no user limits with Velocity that is not licensed and that uses cloud technologies in its infrastructure.

[/mk_fancy_title][mk_image src=”https://peakup.org/wp-content/uploads/2023/12/gif_old.gif” image_size=”full” align=”center”][mk_fancy_title size=”20″ font_family=”none”]

7- Take the extra workload off of your IT departments!

Making and tracking updates on intranet portals, especially the ones established with an old infrastructure model or by the company is seen as the work of IT departments. Getting external support or support from IT personnel within the company all the time on portals that are always updated is a burden in terms of both time and cost. Velocity constantly updates itself without the need for IT departments with the ready-made portal feature. That way, you get rid of the extra effort of an employee.  [/mk_fancy_title][mk_image src=”https://peakup.org/wp-content/uploads/2023/12/gif_3.gif” image_size=”full” align=”center”][mk_fancy_title size=”20″ font_family=”none”]

8- Office 365 support 

Since you don’t have to have an Office 365 account, every single one of your workers can log in to the portal easily. Velocity supports logging in with Office 365 accounts and also with just a non-corporate e-mail account; also hybrid access is possible at the same time.

Velocity offers you a unique integration with the chat-based work place inside the intranet solution it offers for Office 365 and Microsoft Teams users.

 9- Velocity for Teams

Microsoft Teams is at the center of team work with over 75 million active users around the world. All the chats, meetings, files and applications can be accessed through one single work area. This way, you enable your teams to work faster and more efficiently together.

Velocity was chosen among the top 8 applications that can be integrated to Microsoft Teams in global with the evaluation done of all the applications. You can communicate and track your work easier with Velocity that you can access on Microsoft Teams. You communicate without any gaps not only in your work process but also with your teammates and managers through your social posts. Even though it is remote, you achieve a workplace with your workmates. You can reach your files, announcements, your documents, horoscope, service hours and another information within the application cards, and share your corporate communication and culture with all your employees simultaneously.  [/mk_fancy_title][mk_image src=”https://peakup.org/wp-content/uploads/2023/12/gif_team.gif” image_size=”full” align=”center”][mk_fancy_title size=”20″ font_family=”none”]

10- Application Cards 

The most important feature of intranet portals is that they have informative application cards. And you can add cards concerning anything you want. You can follow your work processes and social activities with a lot of cards like announcements, service hours, birthdays, files. Thanks to application cards, you don’t waste time searching for a file. All your documents are inside one application card, and you can access the document you are looking for anytime and anywhere you want.

You can facilitate following your intranet processes with the many application cards within one center.

11- Socializing

You can utilize your portal not only to follow your work processes, but also to socialize with your teammates and strengthen your communication. You can create areas where you can watch each other, recommend books, share photos or read horoscope.[/mk_fancy_title][mk_image src=”https://peakup.org/wp-content/uploads/2023/12/gif_friends.gif” image_size=”full” align=”center”][mk_fancy_title size=”20″ font_family=”none”]

12- Access you files and announcements all the time

You can log in to mobile-friendly Velocity wherever you are and whenever you want. Especially informing field workers about announcements made at the office, information, service hours, LPPD, clarification text and work procedures and updating them about all the news is a very achy process for most companies. Thanks to Velocity being mobile-friendly, your workers in different locations can follow your corporate agenda through one portal, access your files and documents instantly. Your files being transportable gets you out of a lot of crises in any negative condition.

13- Program your social isolation against Covid-19

Covid-19 process has brought a long a virus and its effects. You can follow what we should do during this process, what precautions to take, what precautions your company took etc. withing the Covid-19 app cars you have created in Velocity.

You can ensure communication within your company and with other companies concerning decision-making about Covid-19 precautions and make it a fast and informative environment.

You can especially take cautions that would minimize the social distance of your workers at the company entrance and exit and the dining hall. You can organize a shift system where less workers are at the office at the same time and arrange programs where people can follow service hours for a safer and more hygienic trip. This way, you get to start a fast and safe communication process. You can follow entrances and exists of your employees, detect an adverse condition early and take precautions. All thanks to your follow-up system.[/mk_fancy_title][mk_image src=”https://peakup.org/wp-content/uploads/2023/12/gif_end.gif” image_size=”full” align=”center”][/vc_column][/vc_row]

ICT Media KadirCan Toprakçı Exclusive Interview

[mk_page_section][vc_column width=”1/6″][/vc_column][vc_column width=”2/3″][mk_fancy_title color=”#000000″ size=”20″ font_family=”none”]PEAKUP COO Kadircan TOPRAKÇI: “During these times we are going through, in order to make everything we learn permanent and sustainable we have to internalize them first.  This internalization is critical since it triggers the process of trying, failing, overcoming mistakes and obtaining personal experiences and than conveying it to other people.Because most of the digital tools we use are created to address to general audience and they need personal experiences to be able to customized for your needs.”

Most of the work will be followed remotely

PEAKUP COO Kadircan Toprakçı indicated that most of the workers in Turkey, just like in the rest of the world, follow their works from home because of corona virus. He said that this situation makes remote-working system on digital platforms necessary and added: ” Especially foreseeing that the pandemic will spread rapidly caused a radical change in the education system. Face-to-face education at school gave its place to TV and internet.”

Toprakçı who stated that when we analyze the process we are going through a lot of solutions that already exited were put into use said: “Even some large scale companies products that have been bought but haven’t been used become to be used. We can say that the main reason of this is the hardship of adaptation to the new technological tools beyond deciding and buying the right product. In a manner of speaking, it is very important to manage the change correctly. Because of the pandemic users have become ready themselves and this actually shows us how intense and nonstop this process is.”

Advantages of Remote Working

Toprakçı commented on the benefits of remote working for companies and educational institutions: “Remote working caused a basic benefit for companies and educational institutions, and this caused to save time. Since time spent in traffic decreased, this saved 2-3 hours of time for people going to work or school especially who live in a city like Istanbul where traffic is a big problem.

This situation seriously affects efficiency when we add up reasons like preparations for working at home being minimal. It is pretty obvious that with Covid-19, a new technology era has begun. It is very critical to know this process with all its advantages and disadvantages, internalize it and design new processes in accordance with it. For example, as a society we love to communicate face-to-face, drink coffee together, go on breaks at school with our friends. There are some situation that these things not being possible affects individuals’ motivations negatively during this process.  When people stay away from each other, gaining back motivation is left to the hands of each person but not everybody is able to handle this well. Thus in educational institutions the teachers, and in corporations human resources and managers have very important responsibilities. ”

[/mk_fancy_title][mk_fancy_title color=”#000000″ size=”20″ font_family=”none”]Kadircan Toprakçı made these evaluations about keeping all this process sustainable: “Like we talked about before, most of the technological tools we need already exist, what we need to do is to do the implementation correctly and then provide awareness, will, and ability that will cause our users to adapt well to this remote working process and in long term to support people correctly. A lot of domestic and national products support this process with success. For example Velocity, intranet portal solution, creates a copy of physical office environment for companies and enables you to share all the information in the company with your workers, celebrate their birthdays, follow other procedures and access documents from a common area through one single portal.And for the school, all students are having distance education but communication with students and teachers at the school is not going efficiently. Velocity can enable the students to be together, follow education calendar and announcements, to see their friends’ contact information and make communication more effective for schools.”

IT  Departments have a lot of responsibilities on their shoulders

All digitalization processes bring along a lot of workload to the IT departments. In Turkey, only around 1% of all the workers are technology workers which is way under the average of Europe, in order to sustain this it is very important to concentrate on supporting IT teams. For example, when employers forget their user information like e-mail address or password or when they got reset because of security -which is one of the most common problems among workers-, they request support from the IT departments. Workers being able to deal with this situation automatically through a simple SMS that they are used to without needing anyone with PassGate solution developed in our R&D center accelerates the adaptation we talked about in the beginning and helps IT teams handle this extraordinary busy process with success.

Our Internet Infrastructure Passed a Hard Test

According to Toprakçı, Turkey’s internet infrastructure passed a hard test during the pandemic. There was no big disruption despite the business in the net. Thus we can say that Turkey has a good internet infrastructure and general issues concerning speed should be fixed. It is obvious that especially children and teenagers use more internet because of schools switching to distance education. Education materials being online is another reason of this increase. As a result of virus spreading rapidly and “stayhome” shout-outs, being online and the time we spend on the internet increased even more.

Companies, some governmental institutions and independent organizations started to offer their paid or restricted contents free. Toprakçı who stated that most companies spent the first weeks of the crisis trying to understand how remote working functions added: “Basically companies did a needs analysis during this process. We can say that the most basic needs are common work platforms that enable continuous communication, self-service IT application that would enable users to go to IT help desks with problems concerning their user ids, and cyber security solutions that would enable us to do processes like all this communication, remote access and sharing files securely. Within this scope we see that investments are for software apps and security solutions that the users can easily adopt to rather than physical equipment. For the last few weeks we have been getting a lot of requests for using these systems or getting new applications. The important thing here is that not only companies, organization will not concentrate on technology investments. Governments themselves will them be doing these investments too. It is necessary to decrease internet service provider fees or postpone the bill due date. Especially highly used high download and low upload capacity packages should increase this upload limit. This is very important when overcoming this process with minimum damage when we think about video call and cooperation tools used during these ties. It is necessary for the individuals to access these opportunities equally for distance learning and remote working to be extensive.”

Equality in accessing Digital Tools is a must

About the steps of what we need to do to eliminate inequality and to make the education efficient, PEAKUP COO Kadircan Toprakçı told:” “Distance learning existed in TRT School and Anadolu University distance learning applications  and was in use for a long time on TV and on the internet but they were not able to control participation rate efficiently during this process and there was lack of interactivity. We can say that these things are among the essential requirements of a permanent digital education process.We think that it is better to look from the window of teachers and managers rather than the window of students and employees in order to analyze this process correctly. The market research done by our marketing team member Damla Kızanlık shows that the basic issue in adaptation has to do with teachers and managers coming across this process unprepared. Because most of the workers and almost all the students are people who were born into this technology so they adapt themselves easily, but for teachers and managers above a certain age this situation becomes a situation that requires one-to-one support.

During these times we are going through, in order to make everything we learn permanent and sustainable we have to internalize them first.  This internalization is critical since it triggers the process of trying, failing, overcoming mistakes and obtaining personal experiences and than conveying it to other people.Because most of the digital tools we use are created to address to general audience and they need personal experiences to be able to customized for your needs. Thus the first steps to be taken to create an efficient digital work place should be in this direction.

Equality in opportunity is a must in individuals and businesses accessing to digital tools. I think that during these times public institutions should provide support for digitalization as much as the health-based supports for Covid-19.  Especially institutions like Small and Medium Enterprises Development Organization and Ministry of Commerce affect a lot of businesses. During this process even low-budget supports for expenses of businesses in digitalization would be a great contribution to economy. As a matter of fact even if budgets for fairs etc. get rearranged the way I told, at least a sustainable transition period can be achieved.”

Digital transformation will speed up

Toprakçı remarked that we live in a time that digital transformation has sped up. Toprakçı stated that with the transition to remote working; the number of applications that support a lot of features like activity fields where you receive notifications and filter, Chat rooms where you can share documents and images, accessing files in the archive easily, working simultaneously on files with your teammates, video call, sharing announcement and organizing meetings and than added: “The choices of pretty much all organizations are cloud technology focused for on the one hand obligation of remote working, on the other hand making correct investments.We saw that cloud technologies would affect all IT choices before the pandemic as well but we can say that this process has been brought 4-5 years forward. Actually a lot of notions like artificial intelligent, block-chain have become more intense with the cloud technologies. As a result we will see more IT infrastructure technology, necessary communication and cooperation applications for remote working  in the first 6 months of this pandemic. This process is going to be followed by digitalization of paper-based tasks we did in the physical environment and work analytics systems.

This transition I am talking about will prepare as for topics like artificial intelligence, block-chain, IoT and in general terms we will see the benefits of these technologies when they become solutions integrated to our work processes. For example, systems that analyzes the correction of accounting documents shared digitally while remote working with image processing and artificial intelligent applications will increase efficiency drastically or make the change of recruitment and contracts processes possible with block-chain. When we take a look at all these technologies from the perspective of both educational institutions and especially human resources management we expect technologies like virtual reality and mixed reality to reconstruct the learning process. Both for schools and new employees to execute and accelerate distance learning, redesigned learning methods with especially mixed reality will affect the efficiency of processes positively. [/mk_fancy_title][mk_fancy_title color=”#000000″ size=”20″ font_family=”none”]

Security will be in the forefront during the process

PEAKUP COO Toprakçı evaluated the security risks brought along with remote working and education systems like this: “Cyber-security field will continue to become the main attention factor as remote working keeps being the reality of our lives and digital fields take the place of our physical work environment. When companies are trying to take fast steps to maintain business continuity during this process, security is a very important topic that should not be overlooked. Having the mindset of “let’s deal with this first and then we will move onto security” and approaching this situation imprecisely can bring along a cyber attack when we haven’t even overcome the pandemic. For this reason it is important for the companies to evaluate the remote working applications from the security perspective and consult with the experts they work with.

We need to choose application that enable business continuity

Having no time to lose while choosing applications that enable business continuity would cause stress in these situations. The smartest choice here is to choose solutions that already have international security criteria. It will also be very beneficial for the IT Teams. With the remote working and distance learning brought along with pandemic brought the digital identity notion to the focus of all cyber attacks. What our identification cards, credit cards mean our daily lives is what user name and password information that is the base of accessing all our information is in the digital world.Considering that our users names are relevant with e-mail addresses, we are only left with our passwords. First of all, the most crucial thing her is to create the password in scope of certain standards, and changing it in a certain period of time or in some security situations. Thus the primary matter -for individuals and corporations- here is creating a password that consists of more than 8 characters, numbers, letters, and special characters like question marks and parenthesis. Businesses and educational institutions can choose SMS-based password management solutions like PassGate in order to enable users to deal with this process without going through any obstacles. Our second topic after achieving a strong password is creating a well designed security surveillance and action system especially for businesses. Cyber attacks always renew themselves like viruses and attack the weakest points by evolving. Thus it is possible for these attacks to go beyond the precautions we take to protects users. At this point what matters is early detection of security breaches and application of security procedures defined in advance automatically by systems. For instance, when a unauthorized access is done to a user’s account, systems alarming and putting that user in quarantine and restrict his/her access to the company data is a subject that we have been recommending for years and give education on its application, and that we work with companies.

Precautions must be taken against cyber attacks

We see the thin lines in the process when we think about the spreading speed of cyber attacks. Security precautions should be managed by systems that give smart reactions to pre-designed situations with the contribution of artificial intelligence as much as possible. Because we both go through situations that we cannot realize and when we realize these situations we don’t have enough time to call IT teams and request support.”[/mk_fancy_title][/vc_column][vc_column width=”1/6″][/vc_column][/mk_page_section][vc_row][vc_column width=”1/3″][mk_image src=”https://peakup.org/wp-content/uploads/2020/05/ict-media-1-scaled.jpg” image_size=”full” lightbox=”true” align=”center”][/vc_column][vc_column width=”1/3″][mk_image src=”https://peakup.org/wp-content/uploads/2020/05/ict-media-2-scaled.jpg” image_size=”full” lightbox=”true” align=”center”][/vc_column][vc_column width=”1/3″][mk_image src=”https://peakup.org/wp-content/uploads/2020/05/ict-media-3-scaled.jpg” image_size=”full” lightbox=”true” align=”center”][/vc_column][/vc_row]

Power BI – 2020 April Favorites

Hello dear reader! We will be talking about Power BI April updates in this post. They expressed these month’s updates by saying “There are a ton of new features”. But now everything will come to the light! I compiled everything below to give you an idea about this.

Personalize Visuals (Preview)

It has been forever since they talked about this feature, they told that it was coming. Turns out that the month in which this feature is presented to the users is this month. We are facing a different feature. Normally the process while creating a report goes like that: Report designer creates the report, certain people that will use it share their ideas, charts, their places etc. get readjusted accordingly and report is opened to the users. Of course after all this process there are people saying “This chart would be better that way,” “I don’t understand anything from this chart, can we change it to a bar chart?” And right at this point this feature steps in running with the hare and hunting with the hounds and says “Well you change it the way you want dear” to those who are not happy with the chart.

Of course for this, this feature has to be activated in report settings in app.powerbi.com. You can also activate it on the power bi desktop application. And as a chart all the ones that the report contained while preparing come as an option. The more interest you don’t just change the chart, you also get to change the fields added to the chart. Thus at the end of the day, users of this report might see something completely different than the report you created in the first place. I think that it will become a need for the report designers to know who used this feature and made changes in the future.

Relative Time Filter

We usually use year and month for filtering in Power BI, and prefer charts for day-based view. Sometimes we want to use filter slogans that we are use in the spoken language: “Last month”, “Last 3 months”, “Next 1 week” etc. These filters are called relative filters. With the update this month, Relative Time filter comes in addition to all these filters. With this we can add hour, minute filters.

relative time filter

Rectangular lasso select across visuals

We have been waiting for such a long time! Where have you been, where?! :'( We shed a lot of tears while creating reports, but finally it is here. Being able to drag everything with mouse on PowerPoint and not being able to choose here… it did offend me I’ll be honest. Pardon my excitement. Now we can choose by pressing control on Power BI Desktop as well. In my opinion this is the best Power BI April update. 😁

rectangular lasso select

Improved discoverability for conditional formatting

You remember how we were looking for visual titles and colors as if we were looking for happiness? They decided to make them visible and put them right next to the related area. That’s it for this feature. 😊

conditional formatting

Conditional formatting for totals and subtotals in table and matrix

Let’s be honest, we do apply conditional formatting and we are pretty fond of it. On the other hand, every single time we would ask questions like: “Why can we not apply it in totals?” We welcome this highly-voted feature this month. If we want, we can apply it to values and totals together or just to totals. Excellent!

Suggest Questions to Q&A

I wrote about the Q&A title in details in this article about updates. In addition to this, they are adding a new feature to the Q&A visual. Now we can suggest questions. We define some recommend titles for the report users when we put a Q&A field to the report.

Measure conditions in Q&A

In the first version of Teach Q&A, we could only use columns. Now there is measure support as well. Now we can use expressions like “Bigger than a certain value” or “Smaller than a certain value” by using measure conditions. Thus, it is more useful.

Change Detection for Page Refresh

This month, a new feature for the automatic page refresh is presented. If you are wondering what the automatic page refresh, you can take a look at this article about updates. It is a practical feature for frequent refresh scenarios. When you set the page refresh as 1 second, even though the data didn’t change, page refreshed continuously and when you think about it, since data change that frequently, it is an inefficient action. For this very reason, they have created a new approach. With the approach, you create a special measure named “Change detection”.

In this measure you choose the calculation method and the field you will watch the change of and frequency. The diamond we see on the left of “Change Detection” tells us that it is Premium only. 😢 You need to add this feature to this field when you turn on the “Page Refresh” feature. Apart from that, this feature can be used only in Direct Query. You can create a measure for each .pbix file. Premium capacity admin must turn this on in the admin portal.

New Visualizations

Radar Chart

I love using Radar Charts. I think they are very practical when it comes to showing strong and weak areas. There are new visualizations concerning this.

Comicgen

An interesting visualization that can be visualized as emotion and pose in accordance with each KPI has been created.


So much for Power BI April updates. You can click here to download April updates. I am excited to see what awaits us. Take care.

Good game well played.

What to Be Careful About In Online Interviews

[vc_row][vc_column][mk_fancy_title size=”20″ font_family=”none”]With the restriction of socializing in the whole world, the human resources recruitment strategies will change significantly. So, how are we going to adjust ourselves to this?

As you know recruitment professionals carry the interviews online just like the other meetings in the work life. Let’s take a look at what to be careful about in online interviews, and the pros and cons of online interviews together.[/mk_fancy_title][mk_image src=”https://peakup.org/wp-content/uploads/2023/12/gif_start.gif” image_size=”full” align=”center”][mk_fancy_title size=”20″ font_family=”none”]We should keep in mind that just like we get prepared before we go to a face-to-face interview, we should do the same before an online interview.

My first impression is that colors, outfit and body language make up the 55% and speech, tone of voice and emphasis make up 38%, and words and statements make up the 7%. Thus the first thing to draw attention in an online meeting would be our outfit and stance. Even though it is digital, we are going through a job interview so we should be professional. So, for that very reason, we should sit up straight and look at the camera while speaking. This way you will be making an eye contact. Dressing up suitable for the interview will give you confidence. Instead of wearing a shirt and a blouse only, don’t forget to wear a skirt or pants as well as a whole.

Don’t forget to adjust your camera before the interview. A good lighting and angle make a difference. Also having a simple and plain background will bring you into the forefront. If you are not going to be alone at home, you can let the others know that you will be in an online interview. Muting your cell phone is another part of the attention you pay.

The candidates having their resumes with themselves during the interview can be beneficial. There might me something that we forget or miss out on because of excitement. By this means, we can express ourselves more clearly. Likewise, we should not forget to smile as well. While answering the question it is important to be brief, clear and understandable. When the meeting ends we can make sure that the online interview is over and breathe a sigh of relief.

Before going through all these steps you can make a rehearsal with a friend. You can test sound and video system of your computer and your internet. You will have done the first preparation by being cautious in advance. [/mk_fancy_title][mk_image src=”https://peakup.org/wp-content/uploads/2023/12/undraw_online_video_ivvq.png” image_size=”full” align=”center”][mk_fancy_title size=”20″ font_family=”none”]

 WHAT ARE THE ADVANTAGES OF AN ONLINE INTERVIEW?

  • It is more favorable financially compared to face-to-face interviews. You can save time expenses like transportation.
  • Participation rate is higher than face-to-face interviews.
  • It is easier during the recruitment processes. Being outside of town is not a problem for the second interview.
  • As recruitment experts we don’t have to print out candidate’s resume, thus we prevent waste of paper. It is easier to share notes we took on digital with the related persons.

[/mk_fancy_title][mk_image src=”https://peakup.org/wp-content/uploads/2023/12/undraw_online_cv_qy9w.png” image_size=”full” align=”center”][mk_fancy_title size=”20″ font_family=”none”]

WHAT ARE THE DISADVANTAGES? 

  • You can come across technical problems like connection issues, lack of audio or video. While it increases our stress level, it also decreases time spared for us.
  • Most people might stress out in front of the camera and look more stressed than they really are. Recruitment experts carrying out the interview should be evaluating this situation well.
  • Using less body language like hand shaking, hand gestures etc. than face-to-face interviews.Unfortunately we cannot highlight our body language in these interviews.


You can click this link to get detailed information about our IT Recruitment Services. [/mk_fancy_title][/vc_column][/vc_row]

Power BI – 2020 May Favorites

Hello dear reader! Here we are with the Power BI May updates. Compared to last month, this month’s updates are a bit more superficial. But of course there are some subjects that stand out as always. Let’s go and start analyzing the Power BI May updates right away.

1-Apply All Filters

There is a new button in the filter field. What does this mean? It means that now we have some options while applying filters:

  • The report can change immediately in accordance with the values we choose on the filter field.
  • You can add Apply button to filter headers from the filter field. In this step, you need to press this button after making filter choices.
  • You can ad an Apply button that would apply all the filters at once on the filter field. First you do your filters on all the headers and than press this button.

You can access this new option by going to File > Options and settings > Options > Query reduction.


The necessity of it is arguable but to tell the truth, I know that it has been asked if all these new filter pane skills didn’t exist. So it is for sure that their existence will make some happy. By the way with this update we say goodbye to the old filter pane, bye sweetie.

2- Buttons Now Support Fill Images

A feature very convenient for people who want to use different images and shapes instead of writing an expression only. You can put different images to default, on hover, on press, and disabled options. You can access the option where you can use a button for this on the Fill field.


buton image

3-Drop Shadow Support for Visuals

I think this is the most prominent one of Power BI May updates. I am really happy to to have shadow effect! It gives dimension to the chart field and thus is very useful. Before, we arranged these shadowed fields on PowerPoint and than brought it to the Power BI background. By the way, there a lot of options like angle, transparency under the Shadow title. Since we don’t have to do this anymore, a wide range of people will be satisfied. ❤

shadow, gölge

4- Conditional Page Navigation

Drill through option that was on preview is now generally available. Not only that, they also added conditional page navigation! This is a huge step. This means that you can show pages based on users! Let’s analyze its details all together. The main logic is that you need to enter the name of the page that will navigated by conditions into the DAX indicator.

5-Feature Table (Preview)

Actually it is one of the most interesting features of this month. Before, you had to download the Excel Analyzer extension to your computer that would run the Power BI data sets you were going to work on. After this step you had to download the data set connection. Now we can find the Power BI Dataset header on Excel. But for now, you have to have all the Office Insider programs to have this feature. I am waiting for the moment when we will be talking about it in detail when it is available for all users!

filtre butonu

6- New Data Source

  • Witivio

Witivio is an enterprise chatbot platform for employees with a deep integration in Microsoft 365 and the Power Platform. Without code, users can design and monitor chatbots for HR, IT HelpDesk and change management. Chatbot admins can track the usage and the performance of their chatbots to build advanced analytics.

You can find this connector in the Online services section of the Get data dialog.

  • Linkar Connector 

Linkar is a suite of components that facilitates efficient connectivity to MultiValue Databases. Linkar SERVER works with almost all MultiValue Database platforms centralizing connections and optimizing DBMS license usage. Client apps use Linkar CLIENT libraries to interact with the database through Linkar SERVER, with bindings for popular languages. This connector allows easy integration with MultiValue Databases through the Linkar platform.

You can find this connector in the Database section of the Get data dialog.

 Webtrends Connector

Webtrends Analytics is a Microsoft-preferred solution built from the ground up for the nuances of measuring performance of your website or SharePoint environments. This connector allows you to import your data into Power BI via our Data Extraction API (REST) with point and click ease. All reports on an individual profile are now available at once; no more limited report lists. The date range options have been expanded to allow standard report periods as well as custom date ranges. A customer account with Webtrends is required to use the connector.

You can find this connector in the Online services section of the Get data dialog.

Planview ProjectPlace connector

Get work done across projects and teams. Projectplace lets you plan, collaborate and track progress of all projects and assignments in an easy and user-friendly way.
This connector is supported by Planview as the preferred method of reporting on ProjectPlace moving forward. Existing users of the ProjectPlace connector should consider rebuilding their reports on this new, Planview maintained, certified connector.

You can find this connector in the Other section of the Get data dialog.

Shortcuts Business Insights connector

The Shortcuts Business Insights connector enables you to consume, read and analyze your data collected via your Shortcuts point of sale product of choice. Gaining access to this data will enable you to realize valuable business insights from your appointment, transactional, client, employee, product, and service data. These insights will allow you to better serve your customers and anticipate their needs, while growing your business to its full potential.

You can find this connector in the Other section of the Get data dialog.

Vessel Insight connector

Vessel Insight is a vessel to shore data infrastructure delivered as a service. The service enables shipowners, operators, and charterers to capture data from onboard systems such as propulsion, navigation, cargo, VDR as well alarm and engine management systems. Vessel Insight aggregates and contextualizes the data before transferring it to the cloud using the KONGSBERG Global Secure Network. The Vessel Insight Power BI connector makes it easy to integrate and combine vessel data with existing systems and streamline reporting and decision making.

You can find this connector in the Other section of the Get data dialog.

Zoho Creator connector

Zoho Creator is a low-code cloud software which lets you create custom applications for your business. Zoho Creator can collect data, automate business processes or workflows, analyze the data in reports, and collaborate with your application users. The Zoho Creator connector allows you to analyze data and share insights based off all data in Zoho Creator, aside from the pivot report.

You can find this connector in the Online services section of the Get data dialog.


Power BI may notable updates go like that! You can click here to download this month’s update. You can reach our other articles about Power BI here. Take care.

Good game well played.

A Fast Report with Power BI In 18 Minutes and 23 Seconds

Hello dear reader! In this post I created a beginner-level guide for creating a fast report for people who never got to meet with Power BI but want to learn something about it or people who want to brush up on their information. We are talking about 18 minutes here. We cannot even get ready to get out of home in 18 minutes. 😂 If Power BI is not downloaded on your computer you can download the latest version here. Let’s start!

1- Where is your Data Source?

I thought it would be nice to start with a logical question since we know that there is a source that stores hundreds of data. Where is your data source? You have a few mainly known options as data source: SQL Server, MySQL, PostreSQL, Oracle… The Access authorization belongs completely to IT personnel and they are pretty stingy to put these resources into your service –they have justifiable reasons I’ll give you that. Thus, for your various tryouts in the first stage you need to use data sources that can be found online. Kaggle.com is a good website for that.

I myself downloaded this dataset that is about Udemy courses from Kaggle so that you can follow the same steps with me easily. This information about Udemy courses is found in this dataset: Name of the Course (course_title), publish date (published_timestamp), link of the course (url), payment status (ispaid), Price (price), main subject (subject), course level (level), duration of the course (content_duration), number of lectures (num_lectures), number of subscribers to the course (num_subscribes), number of reviews (num_reviews). Because aren’t we all tired of COVID!

2- Connect to the Data Source

When you open BI Desktop you will see the title Get Data under the Home tab. It is attached right next to the most-used in that field. You might have noticed that you can also connect Excel directly. Here we click on Get Data and choose the Text/CSV title. Power BI asks you “Do you want you use this data directly or do you want to use it by making some changes?” every time you import data. I would like to say “I trust my data and choose to import it directly.” but I see that there is a bad data input on the ispaid column, for this I choose Transform. By the way as you can see it divided the .csv extension file itself by detecting the separators.

get data and transform

3-  Edit the Data 

We will be editing on the ispaid column in our data. The information on the column is given with the true/false expressions. We will be changing them as Paid&Unpaid and we will also filter a cell that has nothing to do with either of them.

Change the Data type 

Data type is very important when it comes to data editing. The data type of the ispaid column that we will make changes on is Binary. To be able to change the expressions as Paid&Unpaid we will change its data type as Text. Power BI arranges the data type first every time it imports data and since we are making data type changes after this step it asks “Do you want us to save it as a new step?” At this point it doesn’t matter which one you choose, I requested it to add it as a new step.binary to tezt

 Change the Values

Now let’s change the true expressions as Paid and false expressions as Unpaid on this column. We achieve this with the Replace Values command which is under the Transform tab. Here there is also a value that has nothing to do with the existing expressions and starts with “http..”. We filter this value and make it invisible on the front face.

replace values

This is all that we will be changing on this data. Finally, we close it by choosing Close&Apply. If you want to make a change on the data later you can access this display again with the Transform Data title in the Home tab.

4-Charts

Add the card that shows the number of courses

It is always nice to have cards that have information about the data on the corners. I actually want to get the information of how many courses there are in total. For this I will make the values on the Course_Id Column counted singularly. I hold this title and drag to the report area. It immediately creates a chart for me. I change it with the image of card and indicate that the values on the course_id column will do the enumeration. I transfer it to top right corner.

card

Add the charts that show the number of courses by prices and total hours

Now we are creating a chart for the second information that I am interested in. We take the price and course_id columns to the report area. We change the chart type as clustered bar chart. To see the number, we active the Data Label under the Format. We change the Display units as None. You can see that the numbers are very high in this stage. Just like in the card we change the action as Count for the Course_ID column.

fiyatlaragöre kurs sayıları

We do an action similar to the one above for the hours as well. We change the Price as content_duration and add it to the report screen. We can copy the existing image for this.

saatlere göre kurs sayıları

Add the chart that shows the number of courses by subject and level

We take the subject and course_id columns to the report area. We change the type of the chart as clustered column chart. To show the number we activate Data Label under the Format. We change the Display units as none. In this stage too you will see that the numbers are very high. In order not to deal with the same situation with the other charts we click the course_id column on the column tab upwards and we choose Count(Distinct)[Count(Singularly)] on the Summarization area and we transform it to count the course_id column in our existing chart.

We take similar actions for levels as well. We change Subject as level and add it to the report area. For this too you can copy the existing image.

konularına göre kurs sayıları -2

Add the chart that shows the number of courses by spreading throughout years

About the other chart that we are going to be adding… I saw a published_timestamp column and wanted to use it. Let’s see to which year the highest number of publications belong. For this published_timestamp and course_id take the stage. This time we will use the stacked area chart. After creating this chart, you will see that some of the years are visible, not all of them. This is because the dates generally continue non-stop. In order to fix this and see all years in the chart we go to the format tab and get to the details of the X-Axis title. Here we change Type as Categorical.

Add a Table

Is our screen getting more complex or what? Don’t worry in the end it will not seem complex at all! 😎But for now, we will increase the chaos and do another action by adding a table. Here I saw the web links of the courses and thought that it would be nice for it to go there by clicking the link from the table. If we are on the same page here, let’s go.

Let’s take the columns that will exist in our table: url, course_title, subject, published_timestamp, num_lectures, num_reviews, num_subscribes. The main concern here is to define a field as URL. By choosing the .url column we change the Data Category in the Column tab as Web URL and the url in the table changes into the blue and underlined writing that we are all used to. By making another change we will change it into a symbol. We achieve this by activating the URL Icon button in the Values field under the format of the table.

tablo
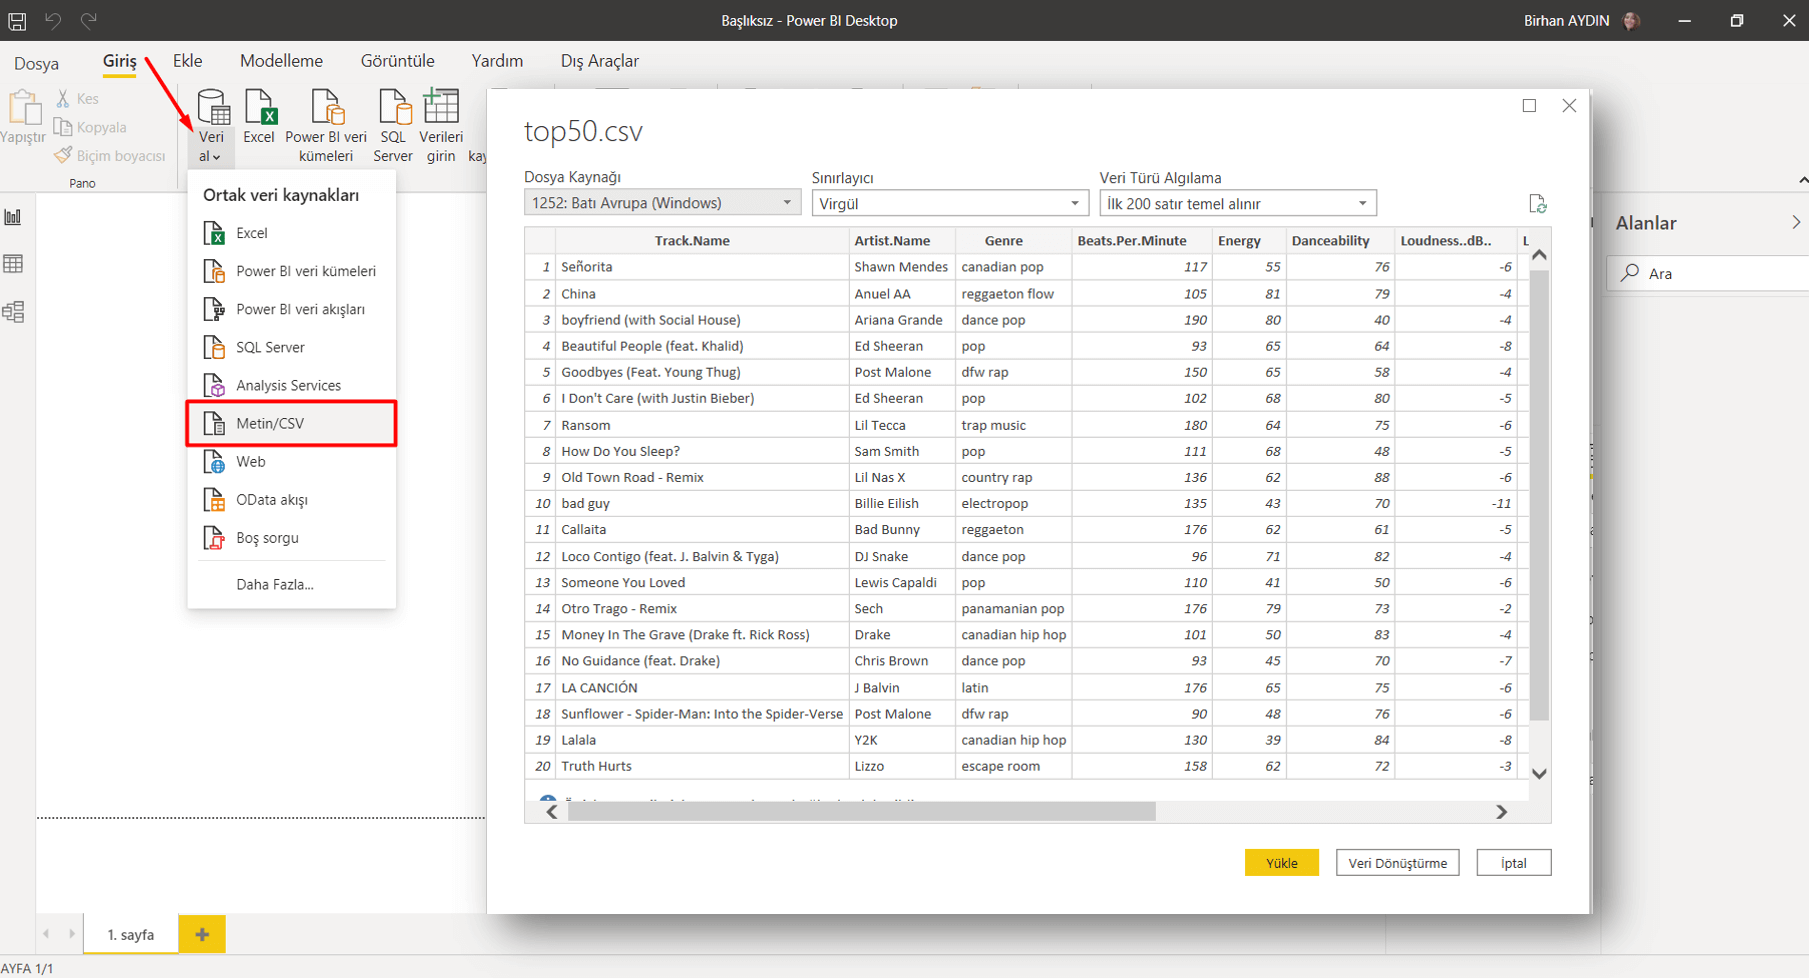
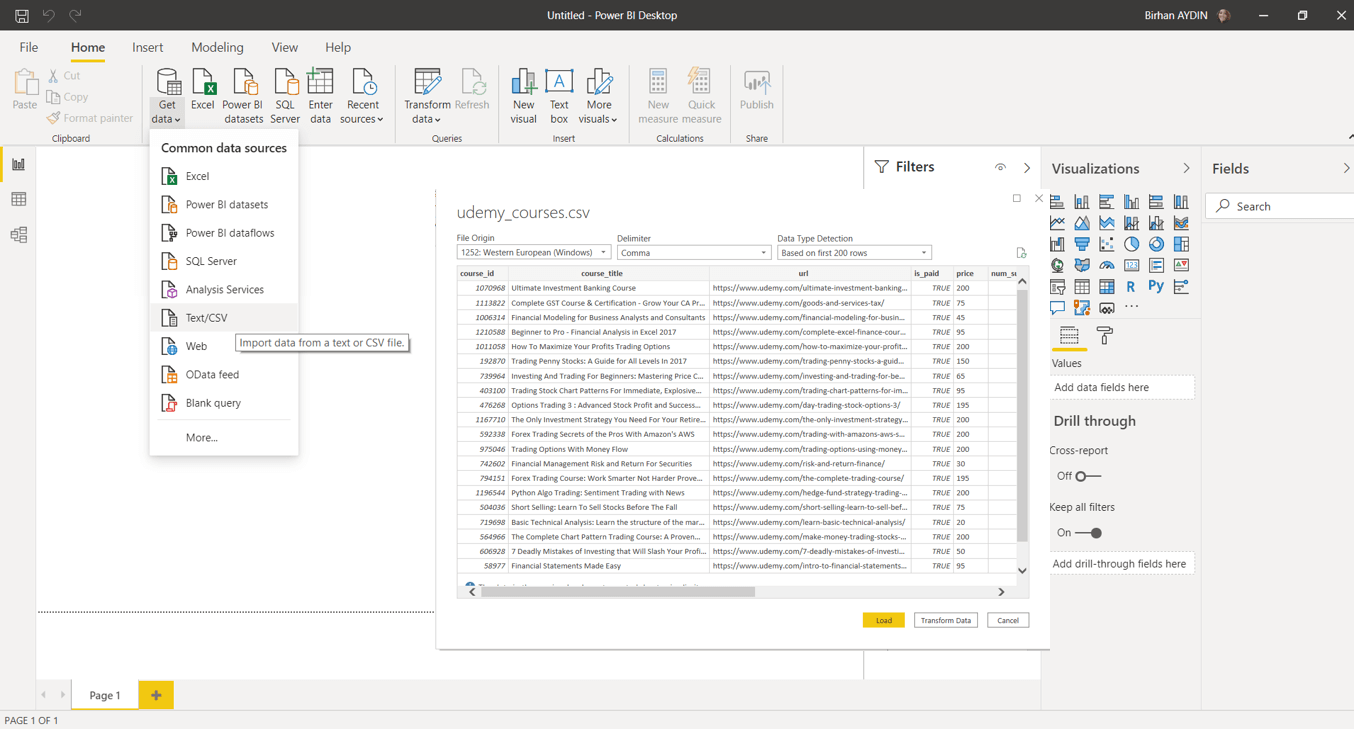
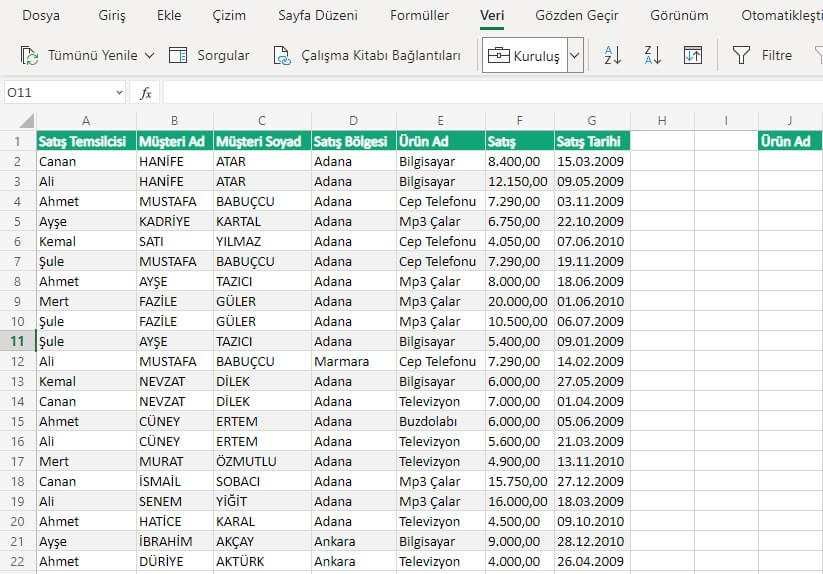
Fundamentally we have added everything that we were going to. Now it is time to organize all this. For this you can follow two options. Since we don’t know the data here, we created charts to see what can come up. In another version if there are fields that come to your mind you can directly start with the visual arrangement.

5-Organize the Page

Spoilers

: From this point on people who enjoy messiness will be sad.

Logo is one of the main factors to make a report seem corporate. We download the logo of Udemy from the internet.

We import it in Power BI. We add the Udemy image by clicking on the Image option in the Insert tab. We usually put the logos on the top left corner, thus we can carry it there.

image ekle

Then we change the background of the page. We will use the code of F6F6F6 for the page’s background. In order for more columns of the table to be visible I change the page size from 16:9 to custom and make the height value 920. Afterwards I choose the Temperature theme that would be closer to the color of Udemy. After the theme all the colors in my charts become dark blue. I don’t want all of them to be same color. For this reason, I change the colors of two of them. You can achieve multiple selection with CTRL.

grafik rengi degistir

Then I change the places of the charts. We arrange the width of our card. We will put two clustered bar charts to the left and right corners and put other charts in between them. We will choose for the grey background to be seen in between the charts and arrange the width and the distance accordingly. After placing the charts for a nicer look, we will use round edges. For this we activated the Border field in the Format tab, change the color to white and maximize the radius.

grafikyeridegistir

Lastly, we give the last form to our table. I chose to close the left gap by making the column titles and the values and the width of the columns bigger. You can also add a small chart to the gap.

tablo

Aaand we are done! With all these steps by holding and dragging we created a fast and a basic report with Power BI. I hope that we haven’t lost anyone on the way while the article was flowing and that you liked it. I wish the best of luck to people who want to work on this report and improve it further, I am sure that there will be amazing visuals! I leave here a fast beginner-level link for you to take a look at our other articles about Power BI. Take care!

Good game well played

Velocity is Among the Top 8 Applications in the World / Hürriyet

[mk_page_section][vc_column width=”1/6″][/vc_column][vc_column width=”2/3″][mk_fancy_title color=”#000000″ size=”20″ font_family=”none”]Digital workplace platform Velocity, developed by PEAKUP, was chosen as one of the top 8 applications in the world. Velocity that has been chosen among thousands of apps uploaded to Microsoft Teams Store is the only Turkish application chosen. A lot of criteria from user-friendliness to prevalence were taken into consideration in the evaluation done by Microsoft Corp. that has its center in Seattle, USA.  

One of the top 8 application among all apps integrated to Microsoft Teams in global was evaluated as the strategic app that is believed to create highest amount of benefits, the app that has authority in digital marketing and the app that has the greatest potential to achieve global prevalence.

The notion of “digital workplace” that everybody is talking about gain more importance day by day in terms of the cloud services it contains, getting rid of geographical barriers with mobility and artificial intelligence apps and enabling access to information 24/7. Increasing employee commitment, making a difference in terms of working together and efficient, content/document management and facilitating work processes are among the most important goal of digital workplace applications. Velocity that has been developed in order to achieve these goals, claim to interaction between workers thanks to its collective structure and provide efficiency in the corporations. [/mk_fancy_title][mk_image src=”https://peakup.org/wp-content/uploads/2023/12/velocity_for_teams.jpg” image_size=”full” align=”center”][mk_fancy_title color=”#000000″ size=”20″ font_family=”none”]The first step of adapting workers who are biased to working on digital platforms fast goes through intranet platforms. Intranet platform Velocity that digitalizes communication processes and makes the use as simple as possible, is one of the most helpful tools in the digitalization process of the companies.

Today Microsoft Teams that has 75 million daily single users and hosts 200 million meeting participants can be ingratiated with digital workplace platform Velocity. Velocity helps you to access a lot of information from your files to announcement, from LPPD to clarification texts and work procedures, from your documents to horoscope and service hours when used on Microsoft Teams. This way you can reach out to all your workers at the same time and at the same speed, and maintain your communication from one center. [/mk_fancy_title][mk_button dimension=”savvy” url=”https://www.hurriyet.com.tr/teknoloji/microsoft-dunyanin-en-iyi-8-uygulamasindan-biri-olarak-velocityi-secti-41512952″ align=”center”]Hürriyet[/mk_button][/vc_column][vc_column width=”1/6″][/vc_column][/mk_page_section]

Microsoft Office 365 May Updates

[vc_row][vc_column][mk_fancy_title size=”20″ font_family=”none”]

A New Meeting Experience with Microsoft Teams

Soon Microsoft Teams meeting will be opened in a separate window than the main Teams screen! Also the control bar on which turn off camera/mute, raise hand, chat, leave meeting options are found will be located on top of the screen. This way the meeting image on the background will not be blocked. The place of control bar was one one the features that got a lot of negative feedback.

And let’s not forget to mention that in the new meeting experience there are 9 3×3 screens instead of 2×2, with the raise hand feature you can send a visual signal that you have something to say and that we can upload our own backgrounds in addition to the recommended backgrounds. [/mk_fancy_title][mk_image src=”https://peakup.org/wp-content/uploads/2023/12/teams-1.png” image_size=”full” align=”center”][mk_fancy_title size=”20″ font_family=”none”]

Adding Online Meeting Option to All Meetings

Another feature coming to our online meetings is having the option of adding “Online” option to all meetings as default. When this feature is activated Outlook Web, Outlook Mobile (iOS and Android) Online meeting option will be added for all Teams and Skype for Business meetings. This feature is not compatible with 3rd Party online meeting applications. If users don’t activate this option, they will add the Online option manually each time they setup a meeting.  [/mk_fancy_title][mk_image src=”https://peakup.org/wp-content/uploads/2023/12/outlook-1.png” image_size=”full” align=”center”][mk_fancy_title size=”20″ font_family=”none”]Mobil:[/mk_fancy_title][mk_image src=”https://peakup.org/wp-content/uploads/2023/12/outlook-mobil.png” image_size=”full” align=”center”][mk_fancy_title size=”20″ font_family=”none”]

Chat and Meeting Between Teams and Skype Consumer

Skype Consumer and Teams working together is one of the most requested features. Finally users in the organization and Skype users can have a meeting and chat. This feature has been on External Access page of Teams Admin Center, now it will be available for active use.[/mk_fancy_title][mk_image src=”https://peakup.org/wp-content/uploads/2023/12/teams-skype.png” image_size=”full” align=”center”][mk_fancy_title size=”20″ font_family=”none”

With the “Pre-publish” option located on the right part of the SharePoint screen it will be possible for the page editors to analyze how page will look after being published and edit if necessary with the preview option before publishing.

[/mk_fancy_title][mk_image src=”https://peakup.org/wp-content/uploads/2023/12/sharepoint.png” image_size=”full” align=”center”][mk_fancy_title size=”20″ font_family=”none”]

Inviting Office 365 Group of Distribution List to Teams Meeting

It will be possible to invite everyone in a Teams team or Distribution List while setting up a new Teams meeting. This way groups/lists will be added as an individual or invitation will be sent to everyone in the group/ list. without setting up a meeting inside the channel.[/mk_fancy_title][mk_image src=”https://peakup.org/wp-content/uploads/2023/12/new-meeting.png” image_size=”full” align=”center”][mk_fancy_title size=”20″ font_family=”none”]

Outlook Web – “Send later”

Soon it will be possible to send e-mails written on Outlook Web later with the “Send Later” option. This feature will come among the Outlook rules and it will be possible to apply this feature in mass.[/mk_fancy_title][mk_image src=”https://peakup.org/wp-content/uploads/2023/12/outlook-web.png” image_size=”full” align=”center”][mk_fancy_title size=”20″ font_family=”none”]

Microsoft Stream Screen Recording

Finally screen recording is going to be available for Stream! Now it is possible to recorde a window or the whole screen and making it professional by adding microphone, sound and webcam options. You don’t need to download any applications, you can you use this feature with the latest versions of Edge or Chrome browsers. [/mk_fancy_title][mk_fancy_title size=”20″ font_family=”none”]

Office.com Main Page Layout is Changing

Now the layout of Office.com portal starts with the option to create a new document with “Start New”, and continues with a horizontal list of our most important applications. New portal is going to be symbolically moved to left vertically.

Current Office.com Layout: [/mk_fancy_title][mk_image src=”https://peakup.org/wp-content/uploads/2023/12/office.com_.png” image_size=”full” align=”center”][mk_fancy_title size=”20″ font_family=”none”]Updated Office.com Layout:[/mk_fancy_title][mk_image src=”https://peakup.org/wp-content/uploads/2023/12/office-gncel.png” image_size=”full” align=”center”][mk_fancy_title size=”20″ font_family=”none”]

Background Policies in Teams Meetings

Now there is an update concerning Teams Admins. Soon we will be able to control new features like blurring or changing background by assigning user based policies. For example we can allow some users to add custom pictures and some to just blur. Policies will be under 4 main titles:

  • No filters are available.
  • Only background blur is available.
  • Background blur and default images will be available.
  • Everything is active: Background blur, adding custom images in addition to default images.

SharePoint Spaces Preview

SharePoint Spaces is a web-based platform, which lets you create structures, themes and backgrounds to which they can add web parts and that contain 3D objects, 360° images and videos, 2D images and texts. 3D results can be watched in the web browser or mixed-reality headset.

[/mk_fancy_title][mk_image src=”https://peakup.org/wp-content/uploads/2023/12/sharepoint-2.png” image_size=”full” align=”center”][/vc_column][/vc_row]

Best Careers For Zodiac Signs and Recruitment

[vc_row][vc_column][mk_fancy_title size=”20″ font_family=”none”] We see that each day a new approach emerges in human resources management. When it comes to choosing candidates there is no scientific approaches; intuition is the most important tool that the employers have. And a new approach is using zodiac signs in human resources management. In recent years, an insurance company in Salzburg, Austria advertised in the newspapers that sales and management department personnel of Capricorn, Taurus, Aquarius, Aries and Leo zodiac signs will be employed. In countries like the USA, Australia, Canada where asking personal questions while recruiting is forbidden zodiac signs are used to obtain information about characteristics of candidates. Nowadays in many countries human resources specialists don’t forget to check zodiac signs and it has become very common to work with astrology. Actually, there are companies that give this service. Jwalant Swaroop from Happy Ho stated: “We had clients who used astrology to choose senior candidates, including IT companies.” If this trend becomes a practice, candidates might start to mention their zodiac signs in their resumes soon. Don’t get surprised if you see zodiac signs in job advertisements.

And now we can talk about job-related features of zodiac signs and which professions are best for them 😊 [/mk_fancy_title][mk_image src=”https://peakup.org/wp-content/uploads/2023/12/burlar.gif” image_size=”full” align=”center”][mk_fancy_title size=”20″ font_family=”none”]

Aquarius (January 22 – February 19)

Aquarius are known for being fond of their freedom. It is the cleverest of 12 signs. Its humanist nature sets Aquarius apart from the others. They act with logic. Aquarius who loves to renew itself is successful especially in professions in the technological area. Working home-office would be very convenient for them considering their need of movement and freedom. The Aquarius loves to explore innovative ideas and is very curious. It can be said that the Aquarius that is mostly found in non-conventional professions is the sign that is least suitable for the corporation life. Convenient areas for you: IT, Engineering, Computer Technician, Astrologist, electric electronic .  [/mk_fancy_title][mk_image src=”https://peakup.org/wp-content/uploads/2023/12/undraw_counting_stars_rrnl.png” image_size=”full” align=”center”][mk_fancy_title size=”20″ font_family=”none”]

Pisces (February 20- March 20).

The most prominent feature of Pisces is being emotional and change. They are not that ambitious. They are very nice to others, suitable for teamwork and also have very strong intuition. They are not successful at jobs that require authority and harshness. They have the best imagination and can be successful at art. Intuition and help oriented jobs would be better for them. Areas for Pisces: Psychology, physiotherapy, nurse.

Aries ( March 21 – April 20) 

Aries is suitable for high-energy jobs. It is a full of life, active, competitive and ambitious sign that can’t tolerate losing. They are a leader from birth, they don’t like to work under orders. They are very suitable for being managers thanks to characteristics like deciding right away, organizing people and being punctual. Suitable areas for Aries: Marketing, Sports trainer, manager, soldier, entrepreneurship  [/mk_fancy_title][mk_image src=”https://peakup.org/wp-content/uploads/2023/12/undraw_social_ideas_e8rj.png” image_size=”full” align=”center”][mk_fancy_title size=”20″ font_family=”none”]

Taurus (April 21- May 21)

Taurus is calm, unaccommodating and cautious. The Taurus who don’t like to take risks or get out of their comfort zone are interested in safe and guaranteed jobs. It is one of the signs that are loyal to their jobs. Determined, patients and organized Taurus is one of the most well adjusted people in the workplace and make great teammates. They can work in any position from leader to follower. Also serious, patient, ambitious but intolerant, strict managers might turn out to be a Taurus. Suitable areas for Taurus: Banking, stock market, purchase and sale, real estate.

 Gemini (May 22- June 22)

Gemini are more prone to dynamic jobs. They don’t want to do boring and routine jobs and desk jobs are not the best for them. Jobs requiring trips are very suitable for the Gemini. They are really good at language learning. They are excellent candidates for key positions abroad or jobs that require communication and a social circle. Suitable areas for Gemini: journalism, advertisement, translation, social median expert.

[/mk_fancy_title][mk_image src=”https://peakup.org/wp-content/uploads/2023/12/undraw_lost_online_wqob.png” image_size=”full” align=”center”][mk_fancy_title size=”20″ font_family=”none”]

Cancer (June 23- July 22)

The Cancer is very compassionate. They are one of the most humanist signs and love to take care of people. From the perspective of carrier, they are creative at solving problems and giving advises. Suitable areas for Cancer: Human resources, psychology, kindergarten teacher.

Leo  (July 23 – August 22) 

Leo loves to work at jobs that bring along a title and strength. They are not the best team players to be honest. Courage and domination is their most prominent features. They are always honest and right. Even though they are preferred by any profession because of their strong royalty, because of their bossy aura they have a hard time in positions apart from senior executors. The Leo prefers to  choose  respected jobs in private sector. Suitable areas for Leo: Management, organization management, CEO, director. [/mk_fancy_title][mk_image src=”https://peakup.org/wp-content/uploads/2023/12/undraw_teaching_f1cm.png” image_size=”full” align=”center”][mk_fancy_title size=”20″ font_family=”none”]

Virgo (August 23 – September 22)

Virgo pays attention to the smallest details and are perfectionists in the working life. They see the details that nobody else does. They like to analyze their work really well. They don’t work with assumptions, they act with logic. It is one of the most disciplined signs. Suitable areas for Virgo: Mathematics Engineer, IT, accounting, banking, architect.

 Libra (September 23- October 22)

Libra loves to bring people together. Giving attention to human relations and working with others make them happy. They achieve success in the service sector and human relations. And jobs concerning aesthetics are for them. Areas suitable for Libra: Travel agent, costumer representative, aesthetician, public relations.

Scorpio (October 23- November 21)

Scorpio has a very important place at work with its strong willpower, ability of moving on after the truth without giving up and with its deep-thinking character. They love to challenge and research. They are a bit of control freaks. The biggest disadvantage of Scorpio at work is  skepticism. They have a very hard time trusting. Especially jobs that require skepticism, detailed research are suitable for the Scorpio. Suitable areas for Scorpio: Manager, detective, scientist, archaeologist, crisis and finance management

Sagittarius ( November 22 – December 21)

Just like the Taurus, Sagittarius are one of the best team players. They are well adjusted. They get along well with their managers, they are extroverts. They can deal with stressful situations easily. The full-of-energy Sagittarius loves to learn and travel. Field jobs can satisfy the Sagittarius. They are very successful at sales thanks to their persuasive skills. Suitable areas for Sagittarius: Public relations, sales experts, marketing, import-export foreign trade expert [/mk_fancy_title][mk_image src=”https://peakup.org/wp-content/uploads/2023/12/undraw_interview_rmcf.png” image_size=”full” align=”center”][mk_fancy_title size=”20″ font_family=”none”]

Capricorn (December 22 – January 21)

Capricorn is the most workaholic of all 12 signs. They don’t run away from responsibilities, they are authoritative and disciplined. If they have a goal, they work ambitiously without paying attain to obstacles. They make amazing managers.   They were born to be a CEO. Doesn’t matter the sector, the Capricorn will be very successful as a manager with its strategy-producer and planner characteristics. Since they have the leadership qualification they are wanted  in organizations as administrators. Suitable areas for the Capricorn: CEO, Banking, Computer Engineer, any profession about IT [/mk_fancy_title][mk_fancy_title size=”20″ font_family=”none”]To get more information about IT Recruitment solutions 👇[/mk_fancy_title][mk_button dimension=”savvy” url=”https://peakup.org/global/bt-ise-alim-hizmetleri/” align=”center”]IT Recruitment [/mk_button][mk_image src=”https://peakup.org/wp-content/uploads/2023/12/moon.gif” image_size=”full” align=”center”][/vc_column][/vc_row]