

Hello dear reader! This month’s updates are for those who can resist the charm of sea and sand right in the middle of summer. There are two very important features among Power BI July 2020 updates. Let’s go and take a better look right away.

1- The most important update: Financial Functions on Excel are now on Power BI!
A total number of 49 financial functions are coming to the infrastructure of Power BI. Since we build financial reports on Power BI, it is especially nice to have these functions. These functions added to Power BI have the same function same and syntax as in Excel. You can reach functions and their details here. You can find the names of new functions below.
| FINANCIAL FUNCTIONS | ||||
| ACCRINT | CUMIPMT | INTRATE | PDURATION | SLN |
| ACCRINTM | CUMPRINC | IPMT | PMT | SYD |
| AMORDEGRC | DB | ISPMT | PPMT | TBILLEQ |
| AMORLINC | DDB | MDURATION | PRICE | TBILLPRICE |
| COUPDAYBS | DISC | NOMINAL | PRICEDISC | TBILLYIELD |
| COUPDAYS | DOLLARDE | NPER | PRICEMAT | VDB |
| COUPDAYSNC | DOLLARFR | ODDFPRICE | PV | YIELD |
| COUPNCD | DURATION | ODDFYIELD | RATE | YIELDDISC |
| COUPNUM | EFFECT | ODDLPRICE | RECEIVED | YIELDMAT |
| COUPPCD | FV | ODDLYIELD | RRI | |
2-Notable Update: Azure Maps visual
Another update we see as important is Azure Maps being included among the defaults images of Power BI. But, why is it so important? This chart has different features than the other map charts.
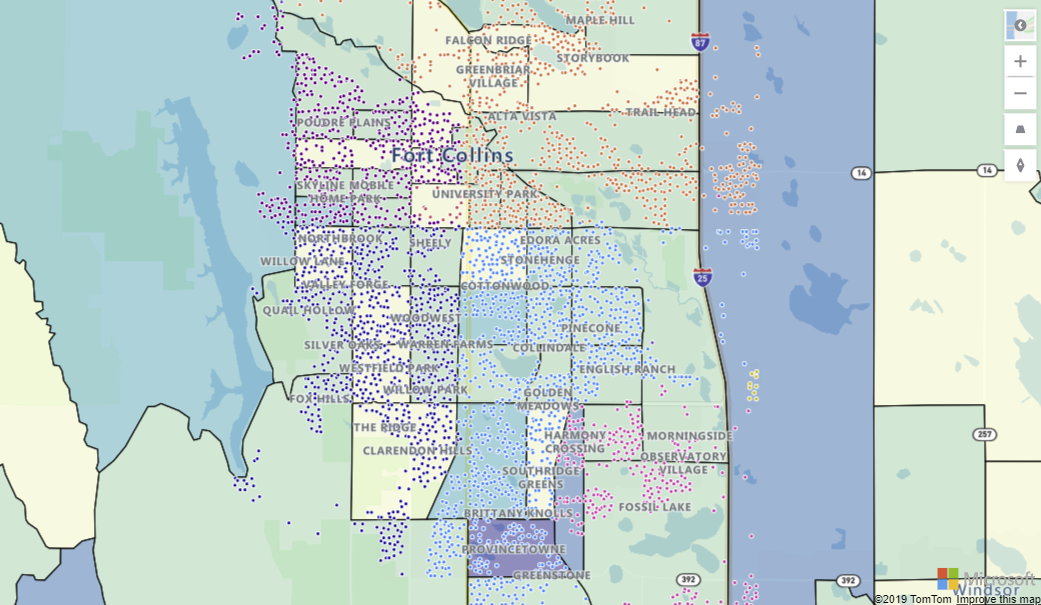
Now we can add extra layers to maps. One of them is “Reference Layer”. With this feature a GeoJSON file containing custom location data can be uploaded and overlaid on the map. This way you can use it as a reference layer containing different information like population and real estate.
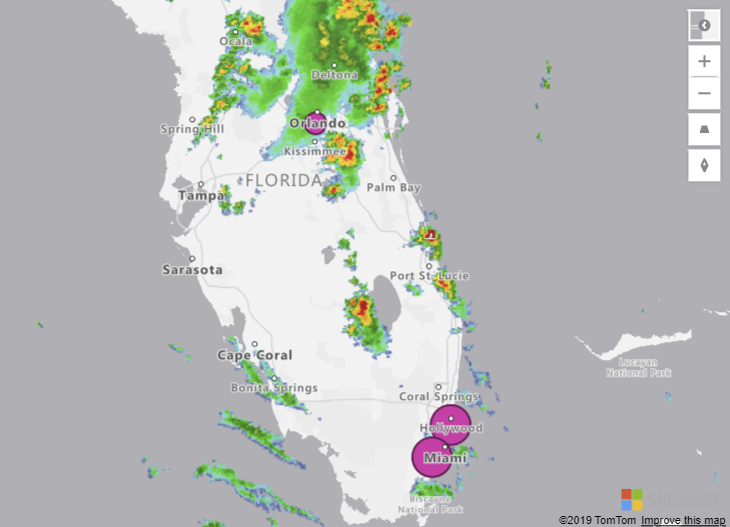
Another one is “Custom Tile Layer”. Tile layers allow you to superimpose images on top of Azure Maps base map tiles. What tiles? For example, weather forecast.
Another standing-out thing is that you can see the real-time traffic overlay on the map in your report. If you work in a logistic related area, it will be very useful for you in terms of increasing efficiency.

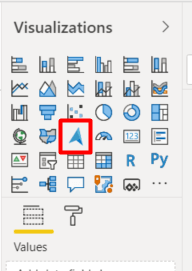
In order to activate this update, you need to activate Azure Map Visual in Preview Features. Then, when you restart Power BI, you will see it among default images on the right .
3-Update: External Tools ribbon- Preview
External tools are non-Microsoft tools that work with Power BI and that allow you to create calculations and calculation groups and analyze data in terms of performance. The prominent ones are:
- DAX Studio
- Tabular Editor
- ALM Toolkit
These feature cannot be opened on Preview Features. We need to create a folder and set up these programs in that file. The folder shortcut should be:
Program Files (x86)Common FilesMicrosoft SharedPower BI DesktopExternal Tools
You can get details about downloading these tools here.
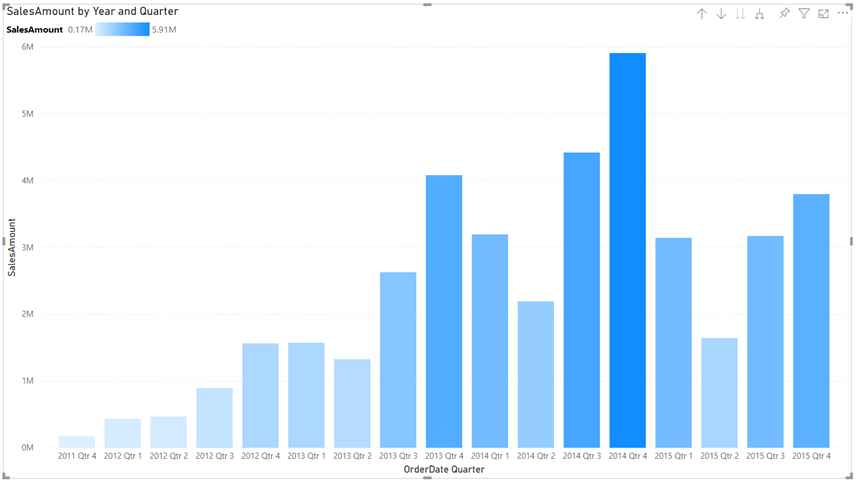
4- Gradient Legend
You can now see the color scale that have been conditionally formatted by columns and bar charts as a legend. Of course, unless you add a legend on purpose.
5-Global option to disable automatic type detection
Power Query tries to automatically detect column headers and types based on the data. This feature didn’t function on schema-less data sources and we had to fix it manually. Now we can disable automatic type detection against schema-less sources. This new option can be found under the Options dialog under Global > Data Load.

We cannot talk about data sources in Power BI 2020 July updates 😮 We haven’t come across this situation for a while. If you want to see prior Power BI updates or take a look at other Power BI articles on our blog, click here. Till the next time, take care!
Good game well played