Give a Magic Touch to Your Office Programs with Add-ins

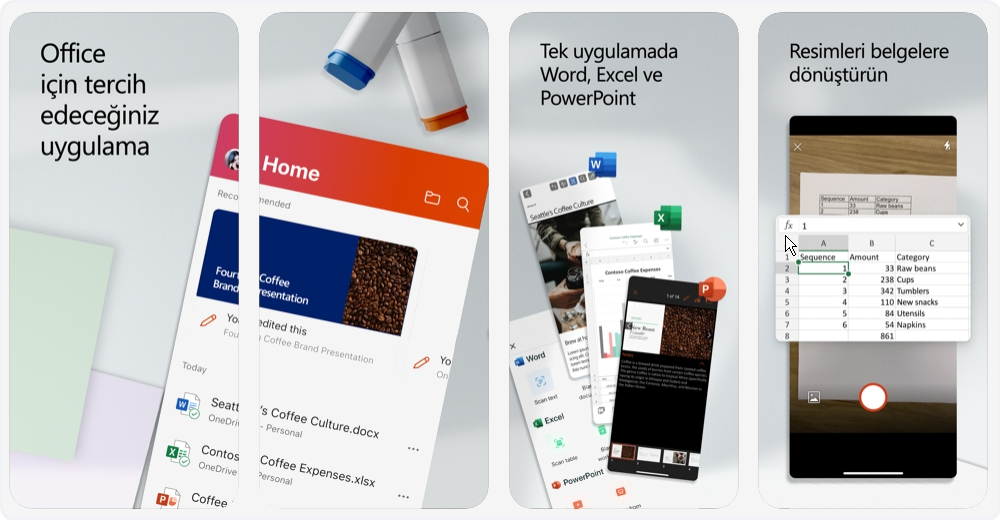
You customize you Office products like Excel and PowerPoint by adding features that are not standard.

There are a lot of add-ins like map graphs, Power BI extensions, Forms polls, Emoji and Stickers.

You can find the Add-ins in the Insert tab.

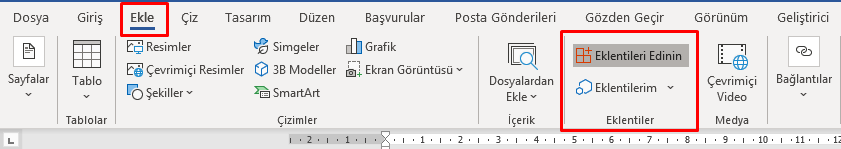
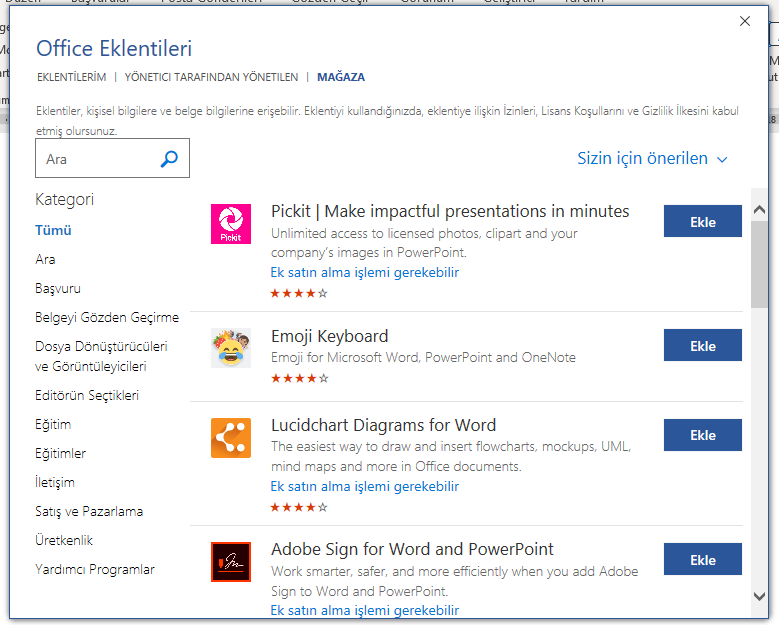
You can choose and use useful and interactive add-ins from various stores.

Excel – Bing Maps Add-in

Allows you to show data like Latitude, Longitude, City and Country in your Excel lists with points on Bing Maps.

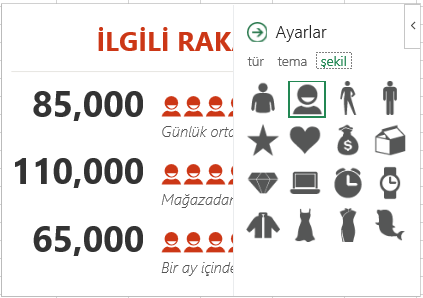
Excel – People Graph Add-in

How about using symbols instead of using standard Doughnut or Column charts?

With this add-in, you can express your numeral data with symbols.

You can customize the theme, symbol and chart view and use them the way you want.

Excel – Selection to HTML Add-in

What do you say about an assistant that writes the HTML codes for you?

You can turn all the data in your Excel list -including tables and text- into HTML text directly.

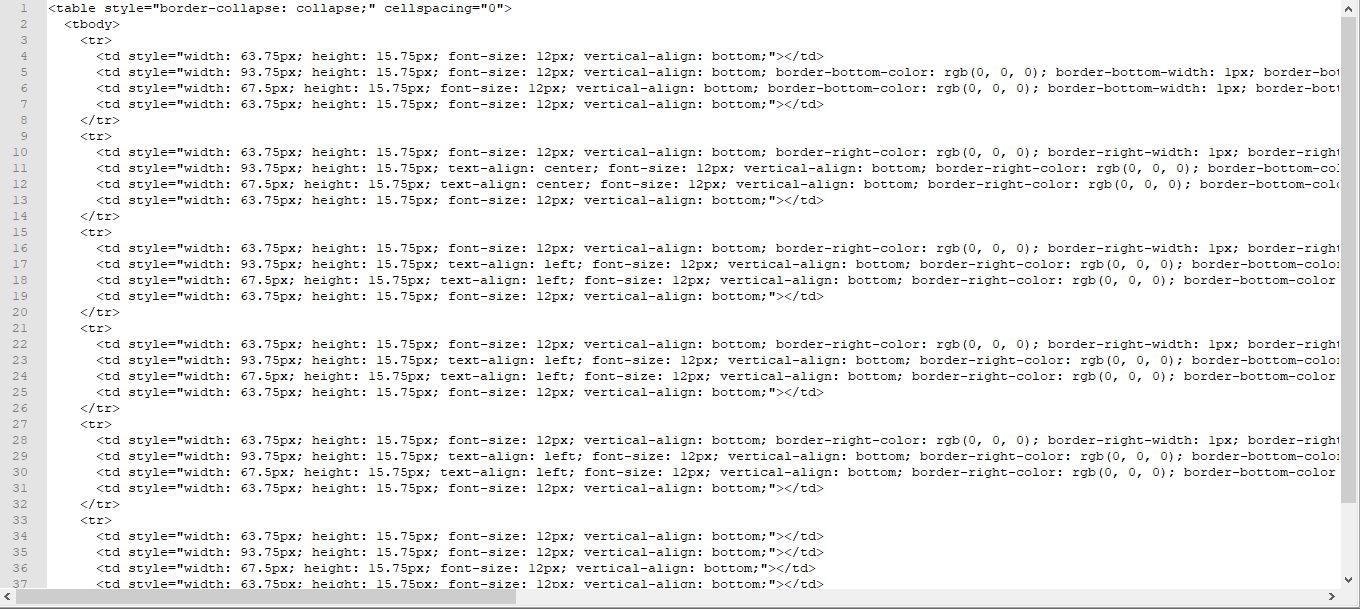
All you need to do is to choose the list range that you want to turn and then press the COPY HTML CODE button that is located in the window of the add-in.

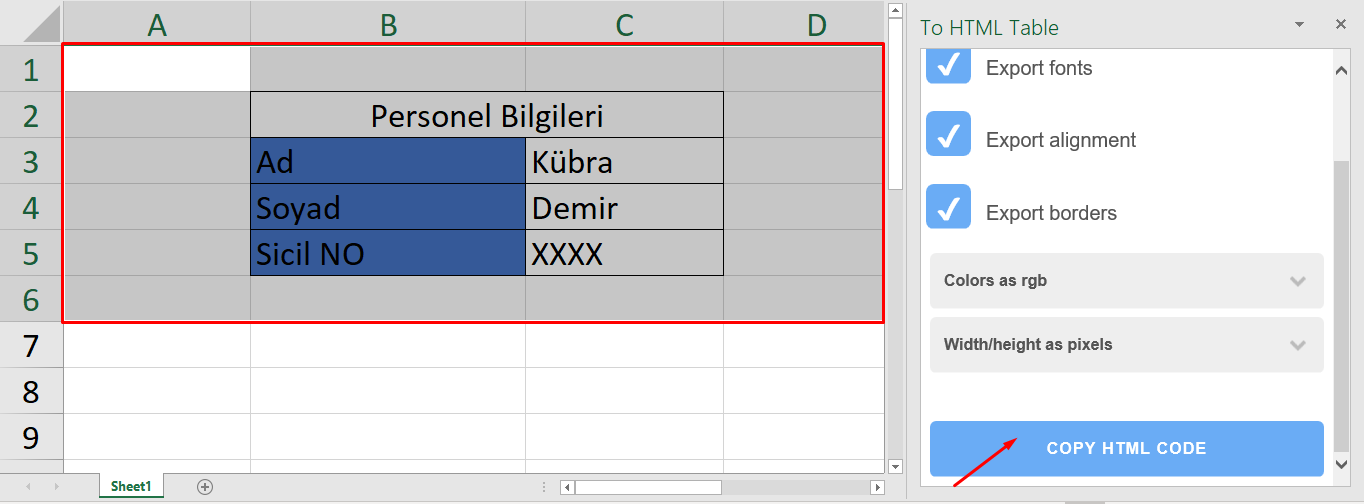
HTML codes have been created and copied in the background instantly, now you can paste them anywhere you want and use them.

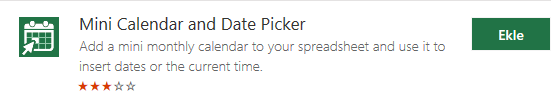
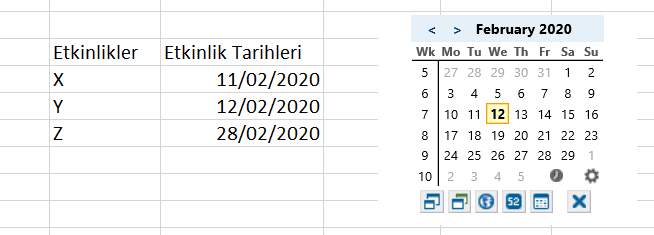
Excel – Mini Calendar and Date Picker Add-in

You can quickly plan with the dates you choose from the calendar.

You can customize the features like the week number, the first of the day and color.

PowerPoint – Forms

You can respond the electronic forms during the presentation.

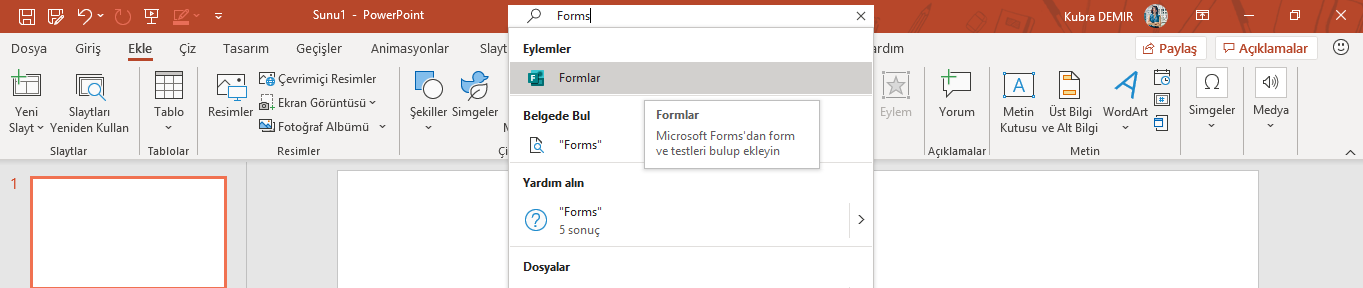
You can add and use any form you want to the presentation with the Forms feature.

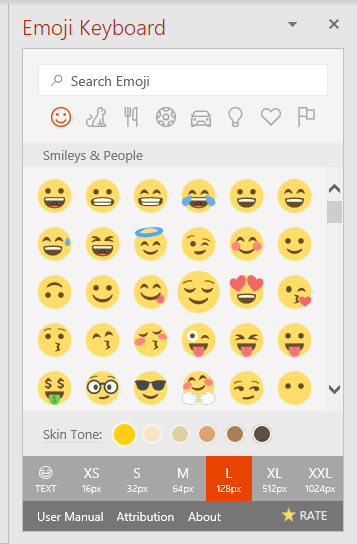
Word/PowerPoint/Outlook – Emoji Keyboard Add-in

You can use the emojis you use on your phone in your PowerPoint presentations as well.

PowerPoint – To Do List Pro Add-in

Do you need To-Do lists during a presentation?

You can keep your action steps as a To-Do list while preparing a presentation.

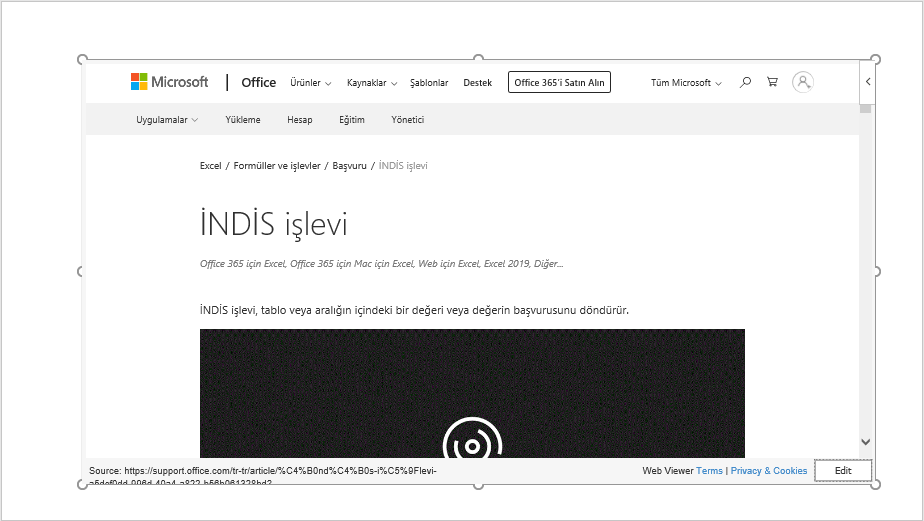
PowerPoint – Web Viewer Add-in

Would you like to show the preview of any website you want while presenting.

You can preview the website without having to stop your presentation and open the browser.

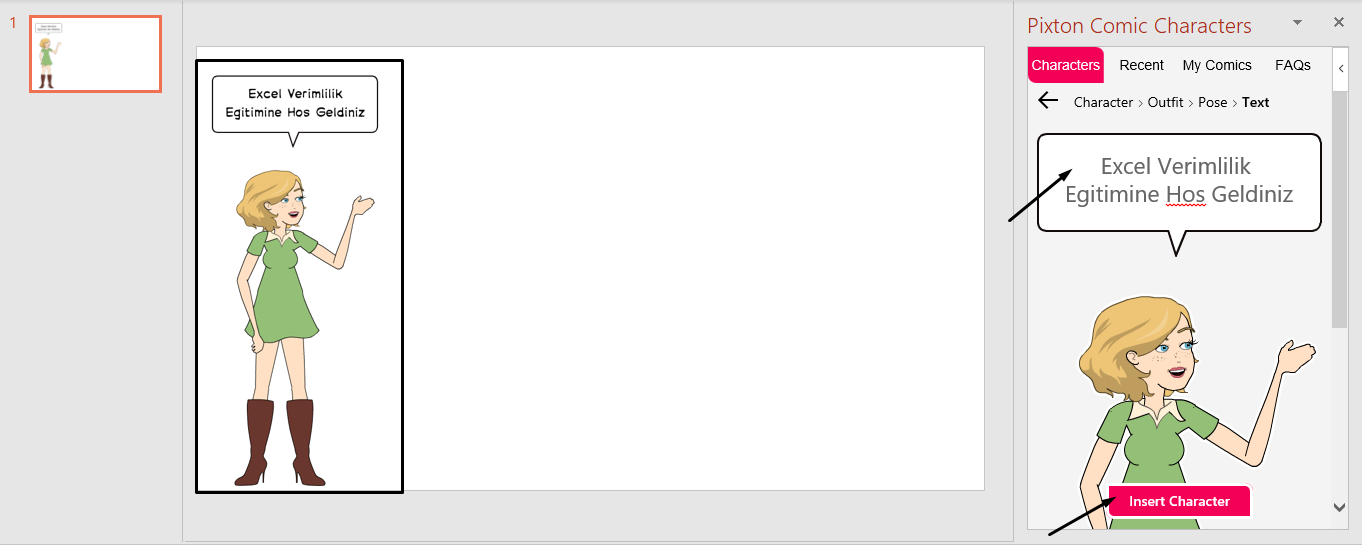
PowerPoint – Pixton Comic Characters Add-in

Make your presentations fun!

You can customize the look, clothes and stance of cartoon characters.

You can make your characters more impressive with speech balloons. Now your presentations are more colorful.

Word – To Do Add-in

You can use To-Do to make your work more planned.

Add information like hour and minute to the tasks and then press the Add Task button. You get to check the task duration with the countdown timer.

Office App Has Been Renewed for Android and iOS

New Office App

Hello everybody,

Working from home has been inevitable during these times where online working systems have become prominent and even an obligation. Being able to work on one application while a lot of digital applications come into our life makes us faster and most productive in business processes.

At this point, we can say that all applications have become more visually appealing since Microsoft started to use Material design. Of course they also added very successful features to all applications. Now; Excel, Word and PowerPoint seem to have come together in one Office App in both Android and iOS devices. Which means that you will be able to access you Excel, Word and PowerPoint apps in one application.


Excel, Word and PowerPoint in One Single App

View, edit and share documents without having to change between multiple apps. We recommend you to try this new experience with its design and new features. 👍🏻


You can download the new application here:


New Features

  • Create PDFs from images or Word, Excel and PowerPoint documents instantly.
  • Sign PDFs with your fingers.
  • Take quick notes with sticky notes.
  • Scan QR codes to open links.
  • Take a picture of a documents and turn it into an editable Word document with one button.
  • Turn a table’s picture to an Excel e-table to be able to work with your data.
  • Let PowerPoint help you to create a presentation by choosing the pictures you want to use from your phone.
  • Create advanced digital images of white boards and documents with the Office Lens features that are integrated to the app.


You will love the promotional videos.🤗


Open your Reports with Report Filter Pages

Before we get started with the topic, I want to talk about PivotTables shortly. When we want to report from tables or lists, we usually start by creating a PivotTable. PivotTables helps us to create tables that we can customize without touching the main data at all. PivotTables enables us to execute actions like reporting, calculating, editing tables easily, formatting and filtering easily. And the topic we’ll talk about in this articles is Report Filter Pages.

In the example below, a PivotTable has been created from a list that containes data like Company Name, Personnel Name Surname. The column titles added to filter field in PivotTable Fields become criteria that can be filtered on the table and we filter with this information. In the sample PivotTable below, the City column has been added to the filters field. And the Personnel Name Surname and Company name columns has been added to the rows field. We will be doing city-based reporting through city-based filtering.

The Long Method

We can observe the change of the table one-by-one for each city chosen from the filter. We might not have some any problems while analyzing a few pages, but when we want to do reporting on more pages we usually don’t prefer this method.

Report Filter Pages

For the City criteria in the filter field, reports of each city will be quickly and practically opened with one click with the Report Filter Pages.

For this action, we click on the Options on the left of the Analyze tab in Ribbon after we add Filter to the PivotTable fields, and choose the Show Report Filter Pages from the list that opens. With this action, the City on the filter field is chosen. If there were a few more filtering criteria, we could choose the criteria based-on which we wanted to report.

Afterwards, the filtered versions of information of cities in all personnel makes sales is opened in different pages quickly.

In the page that’s been opened, we can see the City information. Since there are a lot of cities from A to Z, the cities that didn’t fit in are represented with …

Get practical reports with the Report Filter Pages.