Business Intelligence and Data Analytics Solutions
Turn Your Data into Business
Consolidate and manage all your data on a single platform to optimize decision-making processes and foster a data-driven culture within your organization.
Trusted by Leading Organizations in Business Intelligence and Analytics
Lead Your Business Intelligence Transformation
We’re by your side at every step to help you unlock the full potential of your data. Through tailored consulting, training, and support, we empower you to achieve your business goals.
Support
Always-On Support Services
Let us perform health checks, maintenance, and optimization of your reporting infrastructure.
Consultancy
Industry-Leading BI Consultants
We turn your data into meaningful reports, optimize your analytics workflows, and enhance business performance with powerful visualizations in Power BI, custom Data Warehouse (DWH) design, and AI-powered solutions via Microsoft Fabric Copilot.
Training
Certified TrainersTailored Programs
Power BI Training: Basic to Advanced levels tailored to your organization’s specific needs
SQL Training: Corporate-level training programs customized for reporting team workflows
Powerful Business Intelligence Tools
Boost productivity by visualizing and analyzing your data effectively with Power BI, Microsoft Fabric Copilot, and other cutting-edge BI tools.
MS Fabric
Microsoft Fabric combines data integration, lakehouse, data warehouse, and reporting layers in a single environment. It offers a seamless experience for data analysts, engineers, scientists, and BI developers.
Fabric Spark
Build, manage, and optimize infrastructure to collect, store, process, and analyze massive datasets. Its integration with Data Factory allows you to schedule and organize notebooks and Spark jobs efficiently.
Power BI
A suite of software services, apps, and connectors that work together to turn unrelated data sources into coherent, visually rich, and interactive insights.
Data Factory
A modern data integration platform that enables ingestion, preparation, and transformation of data from a wide range of sources.
Data Activator
A no-code tool in Fabric that triggers actions like email alerts or Power Automate workflows when specific patterns or conditions in your data are detected.
Real-Time Analytics
Empower everyone in your organization to extract insights and visualize streaming data in real time. Ideal for event-driven use cases, log data, and continuous data flows.
Workspace POS Sales
Workspace Online Sales
Workspace Customer
Workspace ADS
Workspace Expenses
One-Lake
A centralized data management solution that consolidates all data in a single platform. It simplifies access across the organization and supports all data types for fast and efficient big data analysis.
Make an Impact in Your Industry
Healthcare Industry
Stand out in your sector with customized reports and smart data management tools. Modernize your operations with tailored business intelligence and analytics solutions.
Retail Industry
Stand out in your sector with customized reports and smart data management tools. Modernize your operations with tailored business intelligence and analytics solutions.
Webinars by Experts
Enhance your data capabilities with our webinars focused on the latest tools and analytics strategies in BI.
Visualization & Reporting
We deliver comprehensive, customizable reports for all your business data. With tools like MS Fabric, Fabric Copilot, and Power BI, we aggregate data from multiple sources and convert it into actionable insights.
What Sets Us Apart
Interactive Reports and Dashboards: Monitor departmental performance with dynamic reports and personalized dashboards. Tailored visualizations help you craft forward-looking strategies.
Real-Time Data Analysis: Make timely decisions with real-time data streams. Leverage the power of Power BI to analyze data accurately and reliably when it matters most.
Contact Us to Unlock the Full Potential of Your Data
Blogs and Webinars
Discover the latest trends in technology, tips on digital solutions and PEAKUP’s latest news.
Power BI is a powerful business intelligence and data analysis tool developed by Microsoft. Users can pull data from various data sources and analyze this data by visualizing it with charts and tables. The reports and dashboards created can be shared and made interactively accessible. Power BI is a platform that can also be used on mobile devices and has a large user community.
Which data sources can we connect to with Power BI?
According to Microsoft, Power BI has more than 150 direct connection data sources. These data sources include file-based data, databases, cloud-based storage solutions, web APIs, business applications and other data sources.
Can I use Power BI without cloud service?
Yes, a cloud service subscription is not required to use Power BI. With Power BI Desktop, available as a free download, you can connect data, create reports and design data models locally.
Can I see the reports on my mobile phone?
Yes, you can. With the Power BI mobile app, you can access it from anywhere.
Is there a need for a separate Data Warehouse?
A separate Data Warehouse is usually not needed when using Power BI. Power BI can connect directly to various data sources and process and analyze that data. However, for large data storage or complex analysis needs, data warehouses or similar solutions can be integrated so that Power BI can access and analyze this data.
Does my data go up to the cloud?
Your data does not go to the cloud unless you want it to. If you connect to the data warehouse with Direct Query, your data will not go to the cloud.
Can I view shared reports with a free license?
It is not possible to view shared reports with the Power BI Free license. The Power BI Free license allows users to create and view their own personal reports and dashboards, but to share these reports with others or view reports shared by others, a Power BI Pro or Power BI Premium license is required.
How often are my reports' data updated with the Pro license?
With the Power BI Pro license, the data update frequency of reports is set to a maximum of 8 times per day. Users can set eight different time periods during the day to update their data sets. This way, data gets refreshed regularly and reports are continuously updated with current information.
What does a Premium license do?
The Power BI Premium license offers enhanced capacity and performance, increased user access, report publishing, frequent data refresh and scheduling, advanced data flow management, enterprise scalability and management, AI and advanced analytics. Suitable for large and data-intensive organizations, this license is ideal for serving a wide range of users and gaining deep insights.
How soon can I start preparing reports?
A new user who starts using Power BI usually needs between 4-5 days. On the first day, the user gets familiar with the interface and learns how to connect data sources, and in the following days learns how to transform data and perform calculations using basic DAX formulas. Then they become familiar with report generation, sharing and dashboard usage. This may vary depending on the pace of work and previous experience. This process can be accelerated with online trainings and hands-on projects.
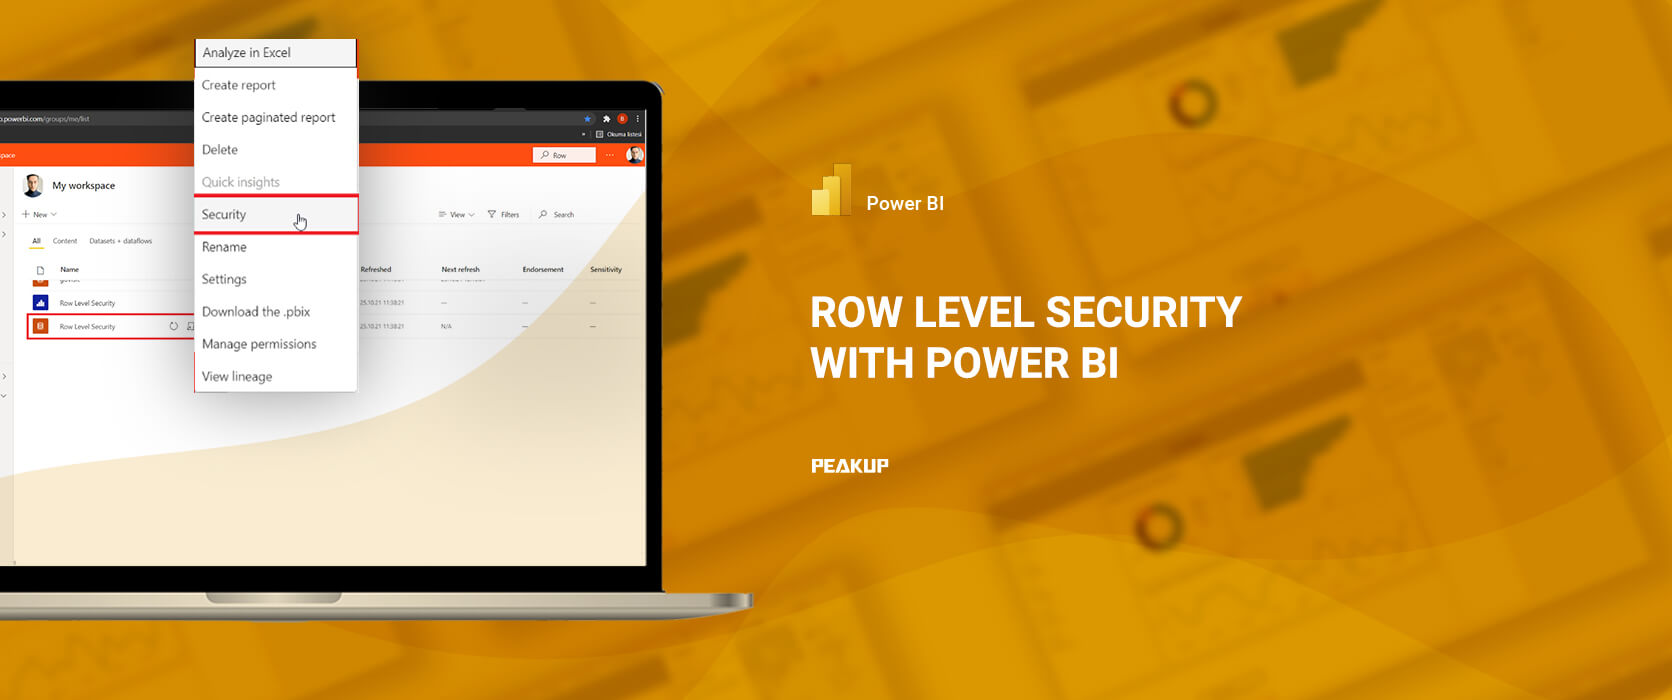
What is Row Level Security?
Row Level Security (RLS) is a security feature used to limit access to data by specified user groups or individuals. In Power BI, RLS allows data in your reports or dataset to be filtered based on users’ identities or roles. Filters restrict data access at the row level and you can define filters within roles.
While you can configure RLS for reports imported to Power BI with Power BI Desktop, you can also configure it for reports using SQL Server and DirectQuery.