
Using the report page you have created in Power BI Desktop as a base, you can create visually rich report tooltips that will be shown while hovering on them. When you create a report page that will be used as tooltips, your exclusive tooltips can contain the visuals, tables, and all the other element collections you have created on the report page.
Shall we try this together now? Let’s go!
CREATING THE TOOLTIP PAGE
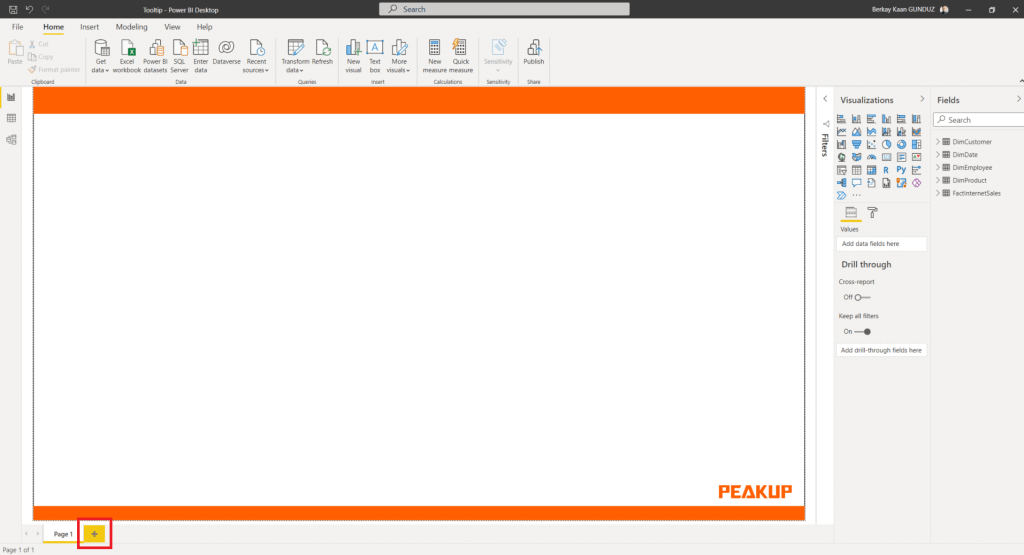
First, let’s create a new page. Click on the (+) sign that is on the right to create a new page. I created a new page with the name of Tooltip.
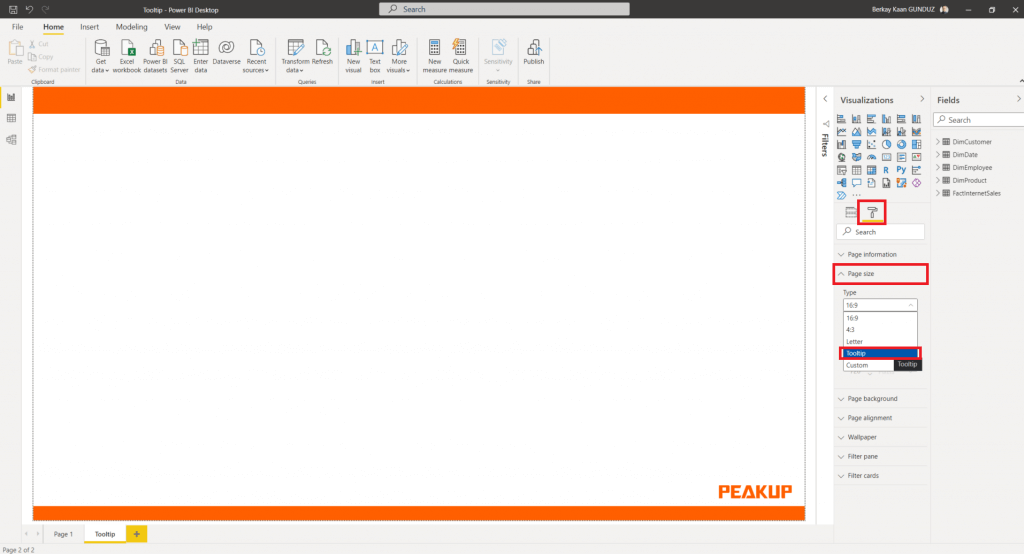
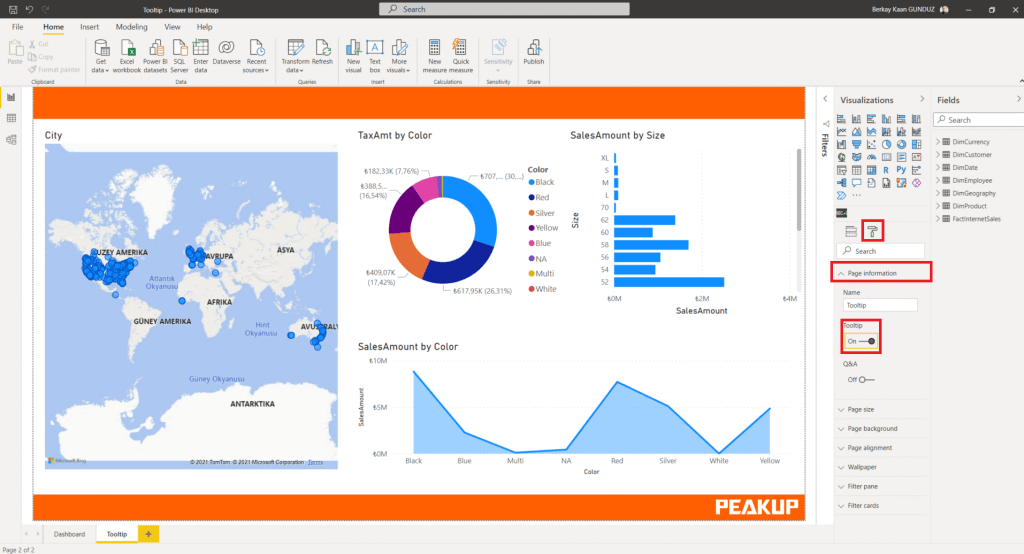
In order to set the new page we have created as the Tooltip page, select the size page as tooltip from the tab that you can find on the right. Here we can also select the normal page size, but keep in mind that the tooltips are located on the report canvas so it is important to keep them as short as possible.
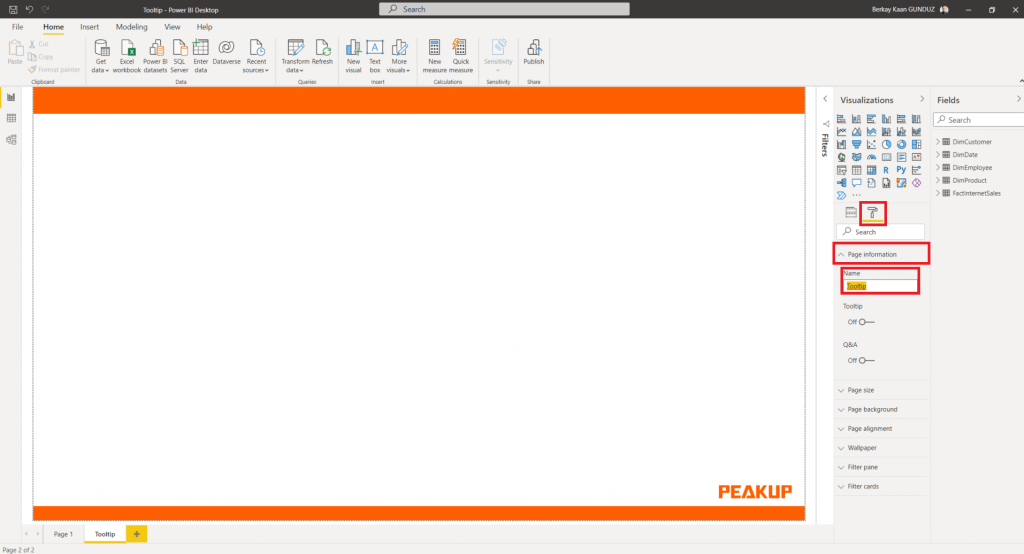
You can name the tooltip page you have created in a way that indicates your goal. It is enough to select the Page Information card in the Style section and write the name you want into the Name field.
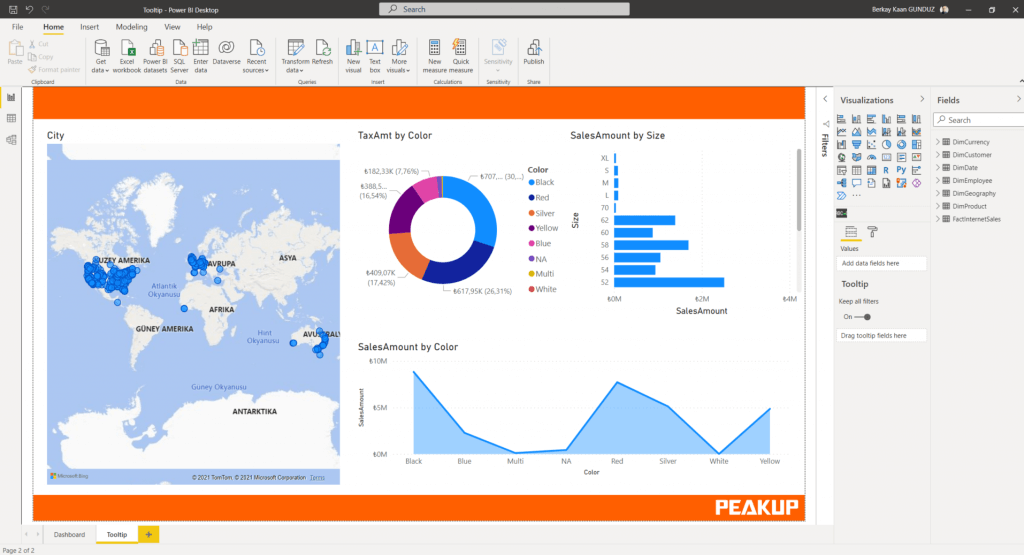
Now, let’s design the tooltip page the way we want. I will be designing a tooltip with the size of a normal page.
CONFIGURING THE TOOLTIP PAGE
After creating a tooltip report page, the page will be saved as a tooltip for Power BI Desktop. It is necessary to set the correct visual on it. First, we need to open the tooltip slider on the page information card in order to turn the page into a tooltip.
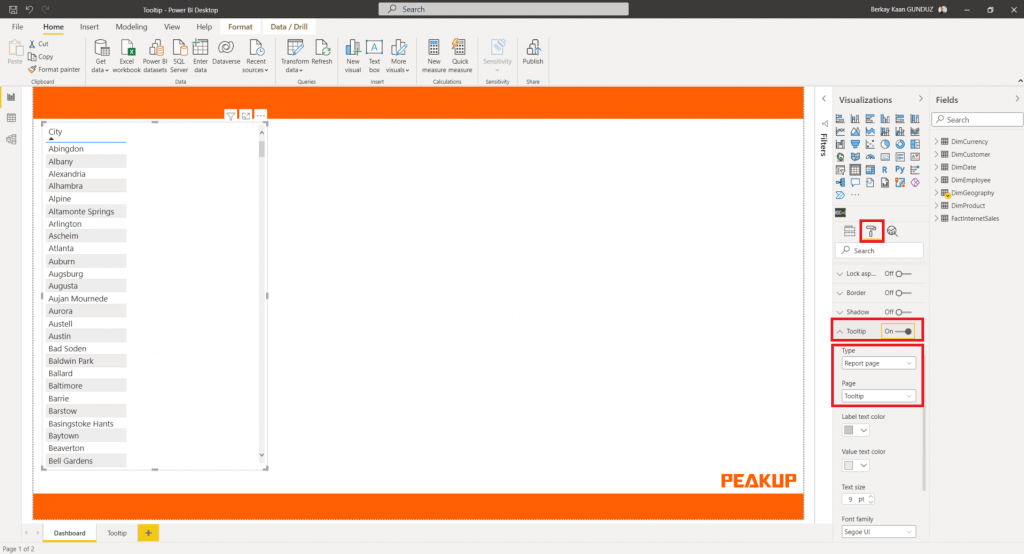
Any visual element that supports report tooltips now has a tooltip card in the style section. In order to set a tooltip, select the visual you want. And then go to the “Style” section of “Visualization” and expand the “Tooltip” card. After activating the tooltip slider, select the Tooltip page you have created as the report page.
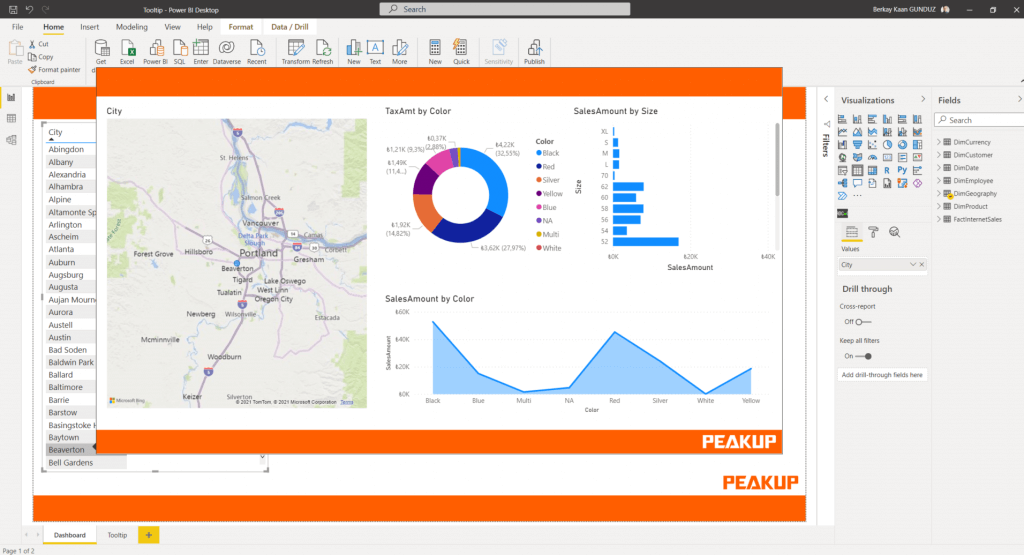
Now our Tooltips are ready for use.
See you again, have a nice day!