Hello dear reader!
February is the same old February again. We survived another valentine’s day. Our lives have gone back to its normal routine. As you know, new Power BI updates come out during these times. And we have come together to talk about this in our article. Seeing some of the features we were waiting made us smile. 🙂
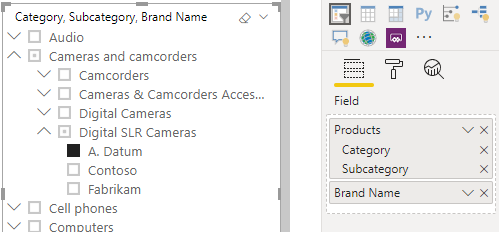
Hierarchical Slicer
They have been asking for this for such a long time! Now, when we add a slicer and put other values under it, it turns itself into a hierarchical slicer automatically. There were filters created for this only back then. The biggest problem of adding a hierarchical slicer is the space it holds up. At first it seem like a small space but then it gets bigger and bigger. And people -naturally- want a report where they don’t have to slide right or left and where they can see the hierarchy at the bottom. I don’t know if they will solve this space problem and if yes how, but I can say that it doesn’t look great when you design the report.
Incremental Refresh
Incremental Refresh allows you to get the latest updated rows from the data source when updating data that is big and that doesn’t get updated everyday and to execute actions faster. This was Premium only before, but there were so many request and messages that they just brought it to Pro.
Updates to the new ribbon
Power BI’s ribbon was renewed and previewed in the previous months. Now there are new updates for this ribbon:
- Now the title of the file we create is in the middle. And on the right, there is user photo and information that we are familiar with from the Office.
- Now we have Power BI on Keytips. When you press Win + Alt keys, you will access the key tips and freely navigate through tabs. We usually don’t let go of the mouse while creating a report, but this still could be useful.
NEW FUNCTION ALERT
The DAX family welcomed the FIRSTNONBLANKVALUE and LASTNONBLANKVALUE functions. We has very similar functions: FIRSTNONBLANK and LASTNONBLANK. They syntax is same for now. So, what is the difference between these functions?
For example, let’s use these two functions with the same syntax in a table with Products and their prices.
- LASTNONBLANKVALUE(Table[Product],SUM(Table[Price]))
- LASTNONBLANK(Table[Product],SUM(Table[Price]))
While LASTNONBLANKVALUE gives me the second part of the syntax -i.e. the sum-, LASTNONBLANK gives me the first part of the syntax -i.e. the information of which product-.
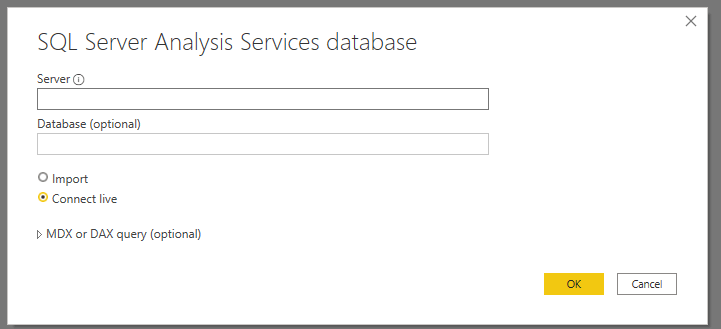
Data Connectivity
Connectors for the data sources below now come to Power BI as default:
- MicroStrategy : The MicroStrategy Dataset Connector for Power BI allows users to fetch data from reports or cubes that reside in MicroStrategy project and import them into Power BI Desktop.
- FHIR : Fast Healthcare Interoperability Resources is the next generation standards framework for healthcare data. .
- FactSet : FactSet provides integrated software and data solutions for investment professionals
- TIBCO : TIBCO’s data virtualization capabilities provide you the agility to adapt to new data sources and technology at breakneck speed and cost-effectiveness.
- Jamf Pro : Using the Jamf Pro instances API, we collect computer and mobile devices details, installed applications, extension attributes, and their group relationships.
- Asana : With the Asana connector for Power BI, customers can build custom, actionable dashboards based on Asana inputs such as custom fields.
We have shared the most important ones of this month’s updated and we will keep sharing. Here is a link for you to take a look at the other articles about Power BI. And here is the link to download this version of Power BI. Take care.