Skip to content

Hello dear reader! In this article we will be analyzing a Power BI DAX Function, the FILTER function. It is one of the most frequently used ones. In our previous articles we talked about most frequently used basic functions like this one. You can read the details here.
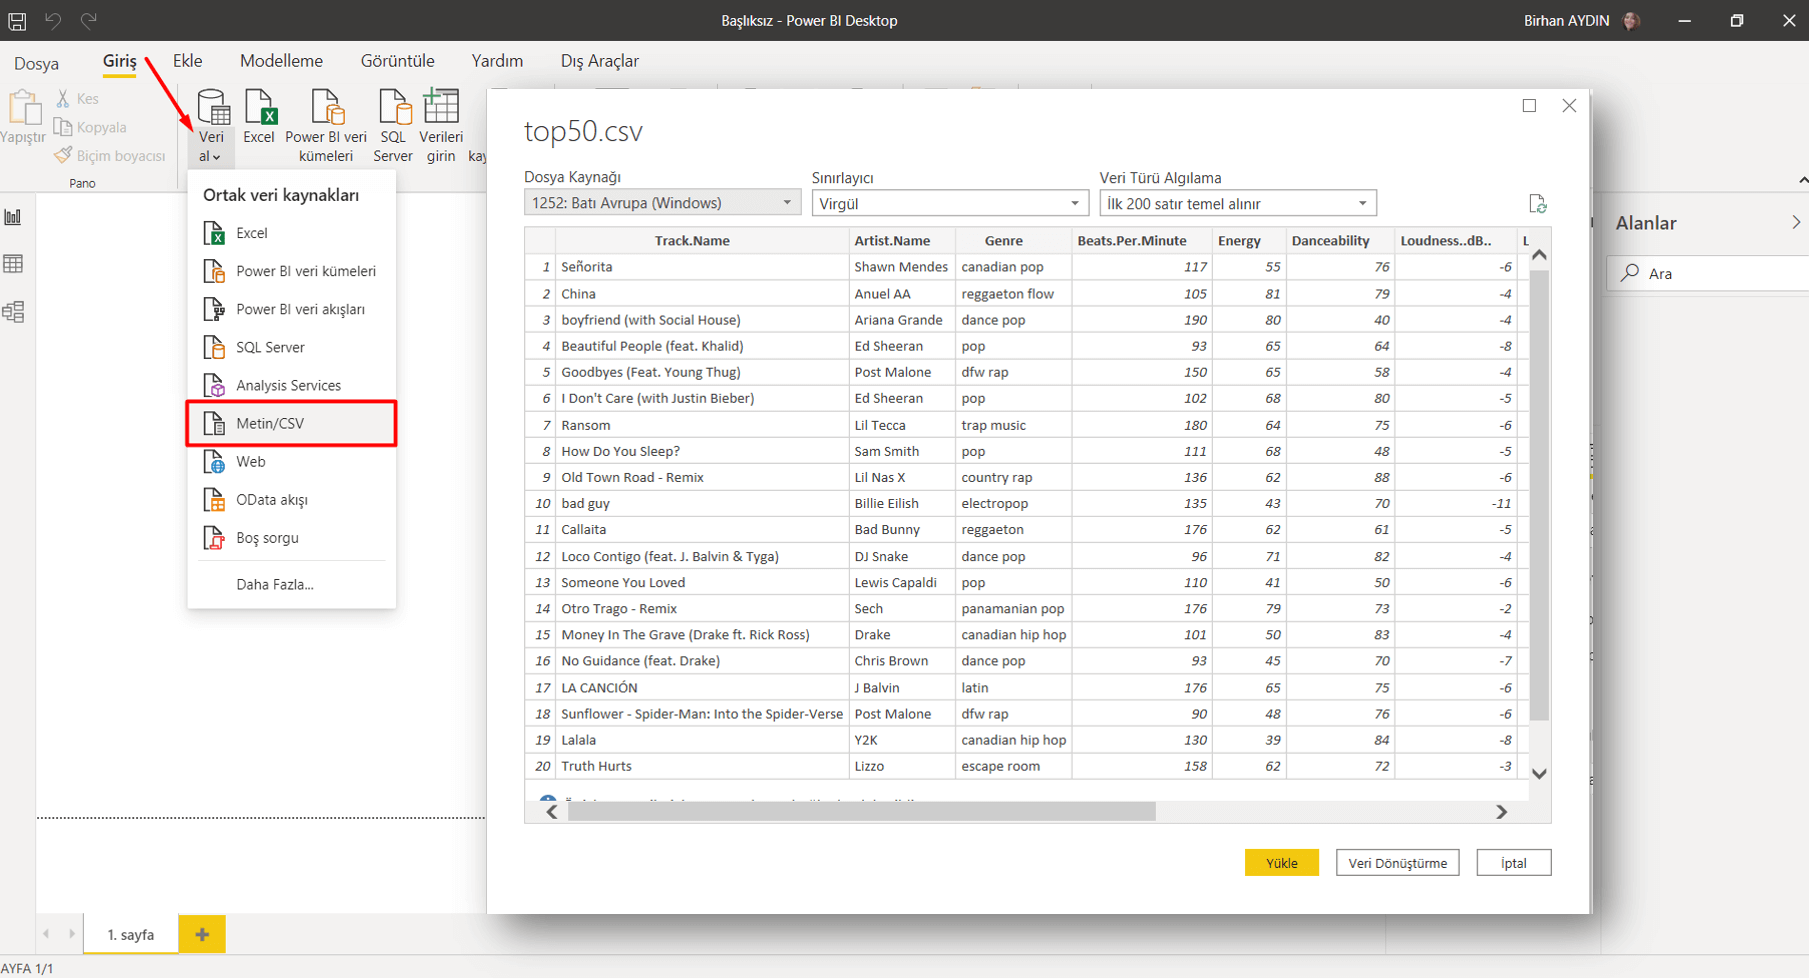
Let’s talk about the data set we will be using first. The data set that we will import from kaggle.com again contains top 50 songs on Spotify and their details. You can download it here.
The FILTER function allows us to create datasets filtered by the criteria we desire. It gives a table as a result of the function. Therefore it is among the table functions. If we are going to use the FILTER function only, if we are not going to use it in any other function, we have to use it with the New Table command. The syntax of the FILTER function goes like that:
=FILTER(
, )
Both of these parameters have to be written, or the function will fail. If we are to explain the filtering a bit more, we can put it like this: True or false statements should be obtained as a result by using mathematical signs like <“, “>”, “=”, “<>”. You can use logical operators (And & Or) for more a complex filtering.
Let’s start with transferring this data set to Power BI. For this we will go Home > Get Data > Text/CSV. To get the .csv file you click OK and it will recognize the separator between texts and show the version divided into columns in the Navigation window. We go Load here and make it load to Power BI.
We will create 2 new tables with the FILTER function in this data set. For this we click on the New Table command under the Modelling tab.
1-Filtering by Numbers
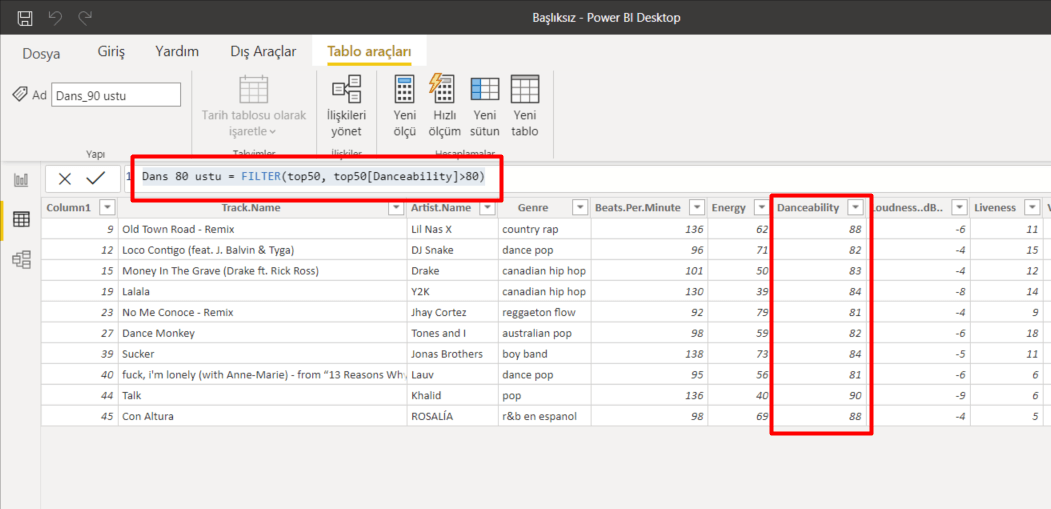
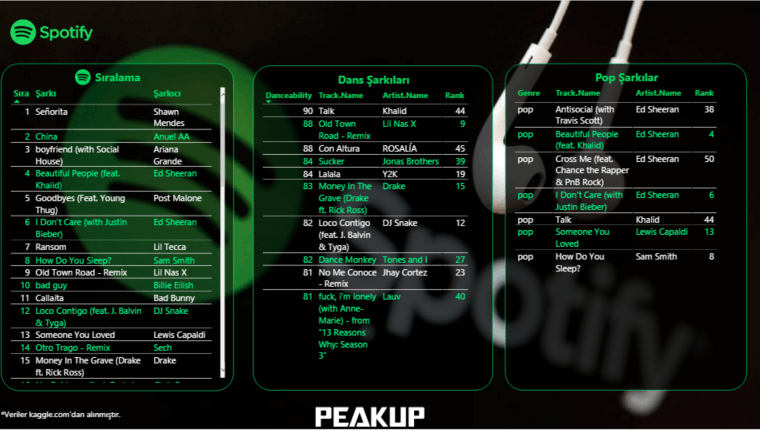
Out first table is going to be of those songs we just want to dance to! The column that will enable us to run this query is the Dancebility column. We will list the values over 80 on this column. To write this filtering statement we will be using the “>” mathematical operator. Since we will be filtering rows on a column, it is going to be enough for us to write the name of that column. The syntax we will write goes like this:
Dance over 80 = FILTER(top50, top50[Danceability]>80)
2-Filtering by Text
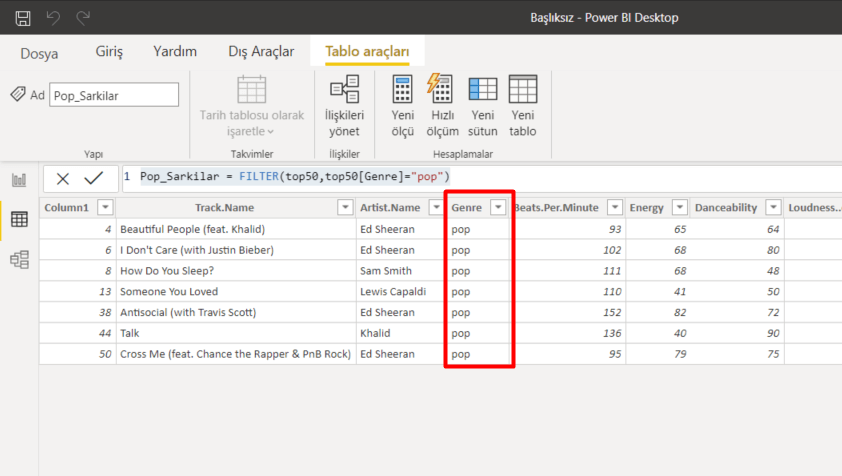
Our second table is going to be listing the Pop songs. For this we will be using the Genre column.
Pop_Songs = FILTER(top50,top50[Genre]="pop")
So we filtered by both text and number. If you paid attention, we didn’t put the numbers in double-quote. Double-quote is used for texts only. And never forget that:
Two single quotes don’t make a double-quote!
I mean apostrophe by single quote. Sometimes some people try to do the action by using two apostrophes. Since this statements has a different meaning in computer language, even though it looks write you will face an error as the result of the function. So I recommend you to always be careful about this.
We came to the part where we move the new tables we obtained from these actions to the report. I moved the columns we filtered first, and then put the non-filtered array to the left. You can get the file here if you want.
We analyzed the the Filter Function which is a Power BI DAX Function. We will keep analyzing other functions, various issues, dead-ends, and possibilities in other articles. Take care!

Good game well played.