
Power BI, Excel, SQL, SharePoint ve daha onlarca veri kaynağına bağlanarak, verileri raporlamaya uygun hale getirebileceğiniz, etkileşimli görseller oluşturabileceğiniz ve şirketinizi anlatan zengin panoları ekiple güvenle paylaşabileceğiniz bir iş zekası ve raporlama çözümüdür.

Power BI, Excel, SQL, SharePoint ve daha onlarca veri kaynağına bağlanarak, verileri raporlamaya uygun hale getirebileceğiniz, etkileşimli görseller oluşturabileceğiniz ve şirketinizi anlatan zengin panoları ekiple güvenle paylaşabileceğiniz bir iş zekası çözümüdür.
DETAYLI BİLGİ ALMAK İÇİN
“Görsel bilgiler, metinlerden 60.000 kat daha etkilidir.”

Power BI nasıl çalışır?
Microsoft Power BI, şirketinizin verileri içinde iç görüler bulmak için kullanılır. Farklı veri akışlarını birbirine bağlamayı, dataları veri modeline dönüştürmeyi ve çıkan raporları görselleştirmeyi sağlayarak zengin grafikler oluşturmanıza olanak tanır.
Power BI en hızlı raporlama aracıdır!
Power BI, Excel’den daha hızlı işlemeye sahiptir. Çok sayıda veri kaynağına bağlanır ve Excel gibi başka raporlama araçlarına göre daha hızlı, etkileşimli raporlar hazırlamanızı sağlar ve sürekli güncellenir. Power BI, kullanıcı dostu arayüzü ve kullanım kolaylığı sayesinde hızlıca verilerinizi görselleştirme imkanı sunar.

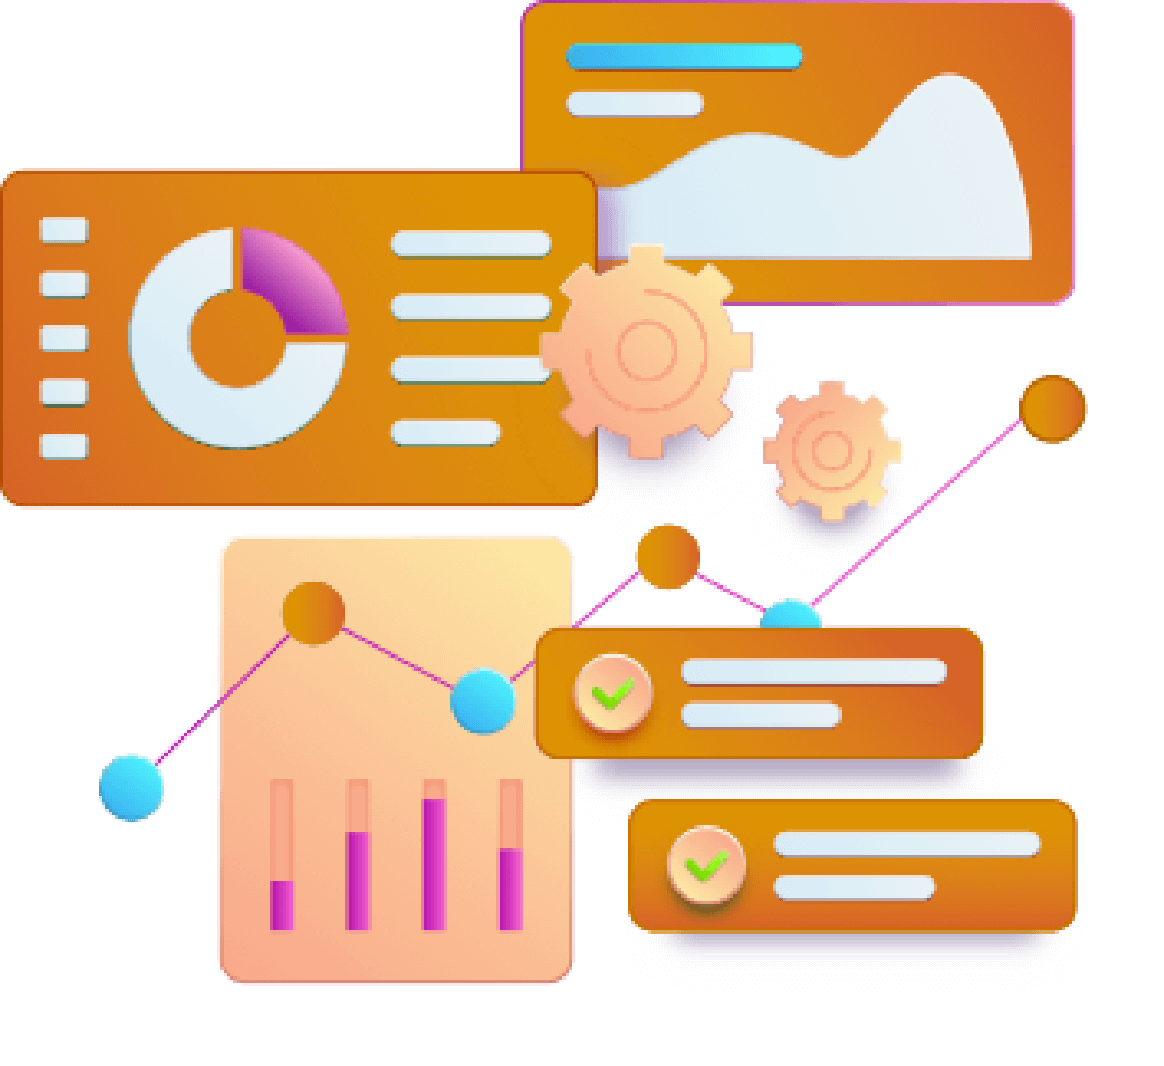
Tüm Pazarlama verilerinizi Power BI’da raporlayın, analiz edin, stratejilerinizi belirleyin!
Sosyal medya hesaplarınızı yönetirken aldığınız dönüşleri tek bir ekranda raporlayın, karşılaştırmalarınızı mecra bazlı olarak da görüntüleyin. Pazarlama stratejilerinizi edindiğiniz içgörülere göre planlayın, dönüşümlü kampanya veya reklamlarınız için en doğru adımları atın.

Profesyonel kadromuzdan alacağınız Power BI Danışmanlığı sonrasında zengin grafikler ile verilerinizi en iyi şekilde okuyabilir, IT departmanından birine ihtiyaç duymadan raporlamalarınızı kendiniz hızlı bir şekilde yapabilirsiniz.

Alacağınız Power BI danışmanlığı ile doğru veri kaynaklarına bağlanabilir ve şirketinize özel Microsoft Teams raporlarınızı hazırlayabilirsiniz.

Mobil ve masaüstü uyumlu raporlar oluşrarak, Lokal veya bulut veri kaynaklarına bağlanabilirsiniz.

İş senaryolarınıza uygun raporlar hazırlayabilir ve ekiplerinizle paylaşabilirsiniz.
ABDİ İBRAHİM BAŞARI HİKAYESİ
Abdi İbrahim ile birlikte yürüttüğümüz danışmanlık süreçlerinde, ellerindeki verileri görselleştirebilmeleri ve kullanıcılarına doğru bir şekilde sunuyor olabilmeleri için çeşitli projeler gerçekleştirdik.
Hazırladığımız başarı hikayemizde Microsoft Power BI ayrıcalıklarını bir de Abdi İbrahim’den dinleyin.
Kurumunuza özel Power BI Danışmanlığı alarak İş zekası ve raporlama araçları ile veri analizi yapın.
Power BI ile Veri Analizi
Power BI ile şirketinizin verilerini doğru analiz edin ve rahatlıkla raporlayın. En çok ihtiyaç duyduğunuz anda anlık raporlara ulaşın.
Verilerinizde saklı iç görüleri keşfedin
İş zekası ve raporlama araçları ile şirketinizde herkese veri destekli bir kültür oluşturun. Kurumunuzun her düzeyindeki tüm çalışanların en güncel analizlerden faydalanmasını sağlayın ve doğru stratejiler oluşturun. Power BI Danışmanlığı alarak şirketinizde veri okumayı kolaylaştırın. Dilerseniz Power BI Eğitimleri alarak da çalışanlarınızı destekleyebilirsiniz.
Her an veri akışı devam ederken siz bu akışın neresinde olacaksınız? Yönetemediğiniz ve takip edemediğiniz veri ne işe yarar? Power BI ile yapılan raporlarla verileriniz takip edin! Dakikalar içerisinde yenilenen verilerinizle her zaman güncel bilgilere sahip olun! Yanlış veri girişlerini anında fark edip düzeltin, yalnızca size özgü senaryolarınızda verilerinizi kullanıma uygun hale getirin.
Şirket içerisindeki aktivitelerinizi, merak ettiğiniz konuları bile rahatlıkla mobil cihazlar, masaüstü bilgisayarlar ve tabletlerde raporlayabileceğiniz Power BI ile BT departmanından birine ihtiyaç duymadan raporlamalarınızı kendiniz kolaylıkla yapın!









Marketing





SIKÇA SORULAN SORULAR
Power BI, Microsoft’un bulut tabanlı iş zekası ve iş analitiği platformudur.
SQL,SAP başta olmak üzere 30’dan fazla veri kaynağına bağlanabiliriz.
Portal içerisinde admin panelinden kolaylıkla widgetlarınızı sıralayabilir,boyutlarını belirleyebilir ve Kurumsal kimliğinize uygun bir yapı haline getirebilirsiniz.
Evet. Power BI mobil uygulamasıyla birlikte her yerden erişim sağlayabilirsiniz.
Hayır yok. Power BI kendi içerinde veri ambarını barındırabilir.
Siz istemediğiniz sürece verileriniz buluta çıkmıyor. Direct Query ile veri ambarına bağlanırsanız verileriniz buluta çıkmaz.
Hayır. Raporları görüntüleyebilmek için Pro ve Premium lisansa sahip olmanız gerekmektedir.
Günde 8 kereye kadar veri güncellemesi yapılabilir.
Raporlara erişecek kullanıcı sayısı 500 ve üzerindeyse, bulut servisinin yanısıra Power BI’ı on-prem’de de kullanmak gibi bir ihtiyaç varsa Premium lisansını değerlendirebilirsiniz. Premium lisans, hem bulutta size ait bir kapasite oluşturur, hem de on-prem’de, yani lokalde kendi “Power BI On-Prem Report Server”‘ınızı kurmanıza müsade eder. Eğer buluta çıkmakla ilgili regülasyonlara tabii iseniz Premium lisansını kullanabilirsiniz
4 günlük bir eğitim sonunda kendi raporlarınızı hazırlamaya başlayabilirisiniz.


