

Paginated reports, long the standard report format in SQL Server Reporting Services, are now available in the Power BI service. These reports can be printed or shared. They’re called “paginated” because they’re formatted to fit well on a page. They display all the data in a table, even if the table spans multiple pages. They’re sometimes called “pixel perfect” because you can control their report page layout exactly.
Well, let’s create paginated report page!
STEP 1: DOWNLOAD & INSTALL PAGINATED REPORT BUILDER ON YOUR PC
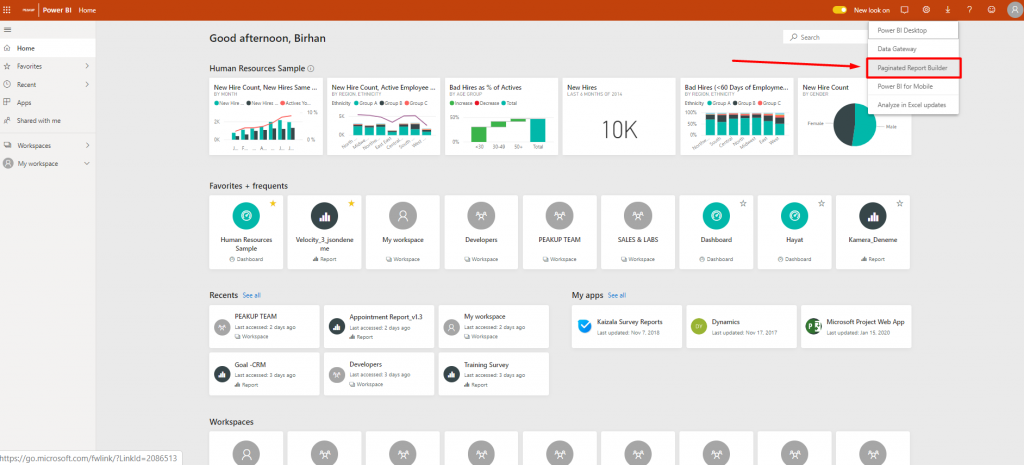
Open your browser and navigate to https://app.powerbi.com/. Click to Download icon than click to Paginated Report Builder.
It will redirect you to Microsoft’s Download Center. You can download the .exe file by choosing the language.
STEP 2: OPEN PAGINATED REPORT BUILDER
Basic wizards are provided to enable you to create faster reports when you open Report Builder. If there is matching report layouts that is similar to what you want to design, you can select it and continue. In this article, I will proceed with an empty report.
STEP 3: ADD DATASOURCE & DATASET
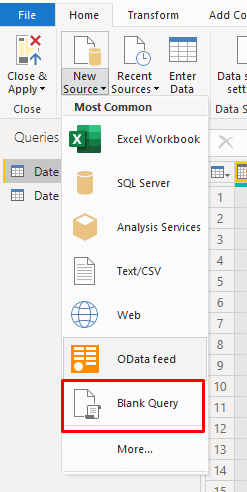
To design a report with Report Builder, first, you should connect to a data source and access data sets from this source. Then, right-click the “Data Sources” in the files area on the left and click on “Add Data Source”. We will start by giving a name to the resource, we will use it in the window that opens. This name is important for us to distinguish this data source more easily. Then, we select the source we will connect to from the list. When we look at the list, we can see that we are facing a much more limited list than Power BI. Since, our sources are on Azure SQL, we select Azure SQL from the drop-down list.
After selecting the connection, it is time to configure the connection settings. Press “Build” and enter the relevant connection information. This information includes server, username & password, and related database information. Do not forget to test it after entering all the information.

After adding the “Data Source”, we will create the related dataset that you will use in the report. Right-click on “Dataset” and select “Add Dataset”. Another window pops up. In this new window, first, we enter the name of the dataset; then, we select the data source we created as “Data Source”. Just down below (Fig.5) , we write a query for this dataset on the query screen. While writing this query, the most important point is to create a paginated report and to specify the parameters with a “where” clause while writing the requested ones in the query field.
By specifying the parameter, we can paginate according to this parameter.
STEP 4: DESIGN REPORT PAGE
At this last stage, we will give the report page a look we want. You can choose what you want to add to this page from the Insert tab at the Top menu. You can add tables, graphics, maps, text boxes, gauges and images as you wish. The most used ones are the tables and the text boxes. Having a logo of your company on the report page will always provide a good corporate identity. I prefer to use “table” in this article.
After adding the table, column headings are determined. Hence, when you hover over a cell down below, “table indicator” appears at the top right corner of the cell. You can choose which column to show here. If you want to add rows or columns to the table, you can right click on the fields on the left and right top of the table and click insert. By the way, number of rows is automatically determined by the data that is provided.
You can change the properties of each component on the page such as text color, background, position, border from the “Properties” on the right.
First, we add a text box to see the related order number on each page. We enter “sales order” to the input TextBox and right click to select “create placeholder” option. The “create placeholder” command allows us to show a metric that varies on each page. Placeholder window pops up to determine the parameter. We will continue from the “Value” section under the “General” section. To set “Value” as metric, click the “fx” next to it. In the pop-up window, select “Parameters” under “Category” to be able to select “SalesOrderNumber” under “Values”. Close the window by clicking “OK”.
STEP 5: RUN REPORT
After editing the design of the report, we run it by clicking “Run”. When the system runs, the builder expects a value from the parameter we created earlier to show the report page. We enter a value for the related parameter, and we get a page depending on the parameter we have entered. If there are parts you want to fix, you can go back to the design by clicking the “Design”.
After that, you can export the desired pages in .pdf format and/or print them.
See you later…

Good game well played.